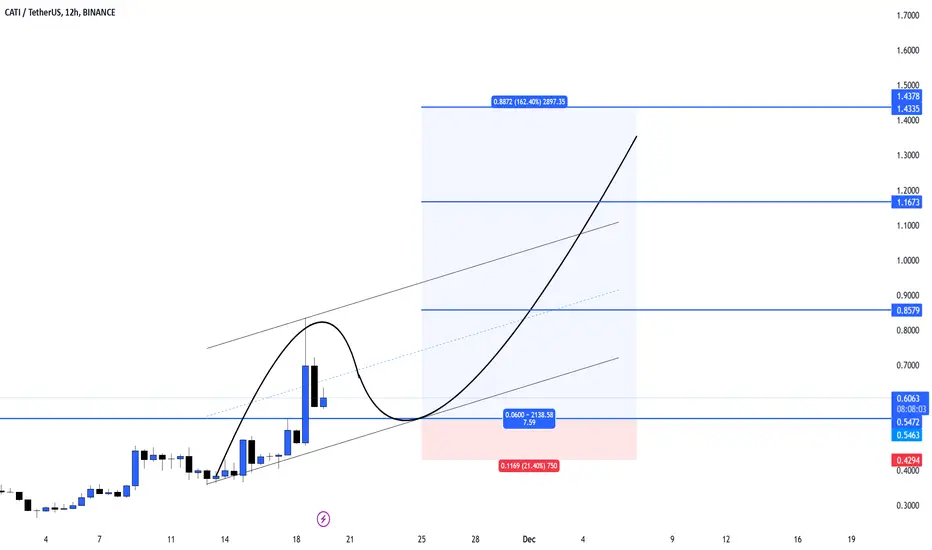
This chart provides a CATI/USDT analysis on the 12-hour timeframe, showing a potential bullish continuation pattern. Here's the breakdown:
Key Observations
Bullish Trend Setup:
CATI is in a strong upward trajectory, with price respecting the ascending trend channel.
After a pullback, the price is forming a potential cup-and-handle structure, signaling a continuation of the bullish trend.
Targets (Resistance Levels):
T1: $0.8579 – The nearest resistance and a key breakout level.
T2: $1.1673 – Intermediate target based on the measured move.
T3: $1.4378 – Long-term target if bullish momentum persists.
Subscribe to my Telegram Channel 👉 :
t.me/addlist/y5mi70s3c0Y3MDQ0
Subscribe to my X 👉 : x.com/VIPROSETR
t.me/addlist/y5mi70s3c0Y3MDQ0
Subscribe to my X 👉 : x.com/VIPROSETR
Disclaimer
The information and publications are not meant to be, and do not constitute, financial, investment, trading, or other types of advice or recommendations supplied or endorsed by TradingView. Read more in the Terms of Use.