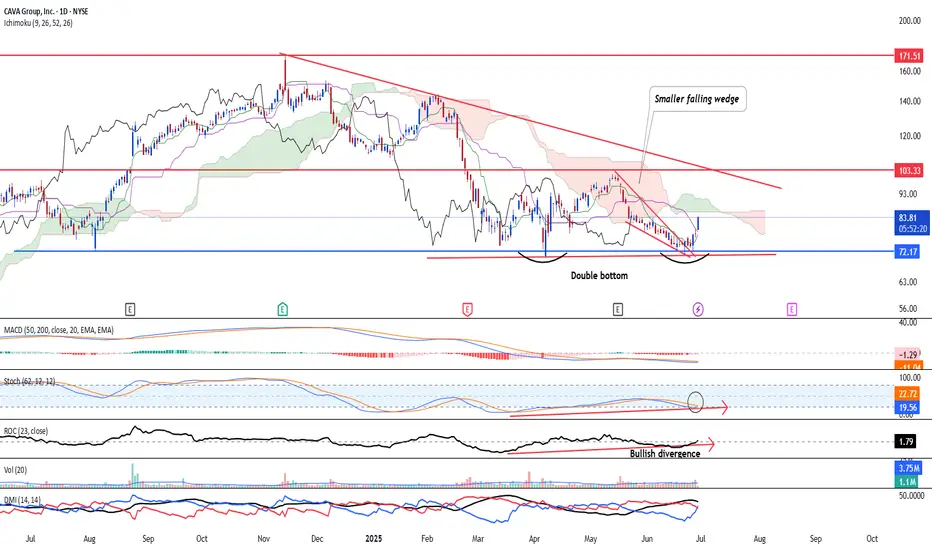
Ichimoku shows potentially a two out of three bullish crossover.
Both stochastic oscillator and 23-period ROC shows bullish divergence AND oversold signal.
Volume wise, last Friday's high volume bar and weak doji candle signals divergence, hence today;s strong bullish opening was confirmed and it ought to rally higher to 125.00 over the mid to longer term period.
Disclaimer
The information and publications are not meant to be, and do not constitute, financial, investment, trading, or other types of advice or recommendations supplied or endorsed by TradingView. Read more in the Terms of Use.
Disclaimer
The information and publications are not meant to be, and do not constitute, financial, investment, trading, or other types of advice or recommendations supplied or endorsed by TradingView. Read more in the Terms of Use.