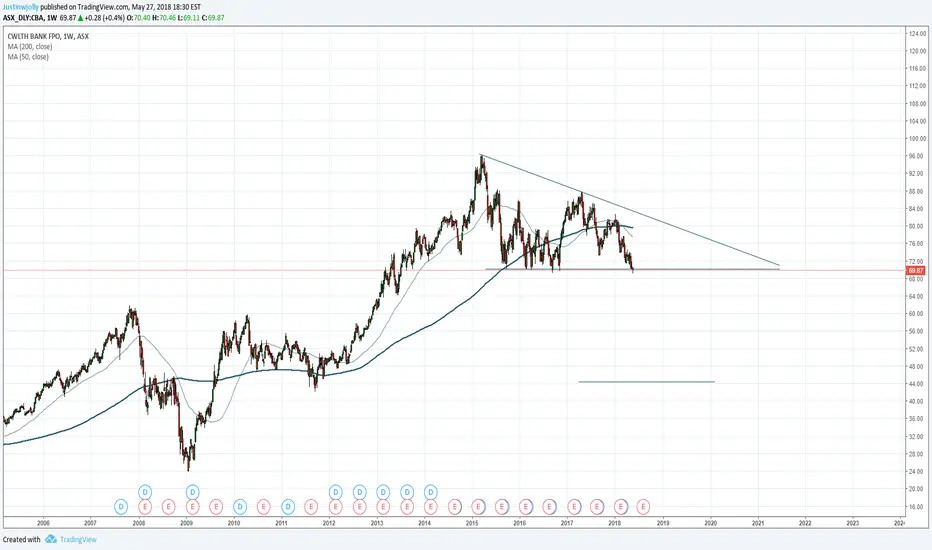
-Huge 9 year pattern
-Lower boundary tested many times with out of line moves
-Established medium term downtrend
-50SMA is firmly below 200 SMA weekly
-Daily retest of underside of horizontal boundary friday close
-Measured move down to 44.37
30 basis points of risk
Could prove quite difficult to trade such a large pattern. If I am stopped out, will wait for a continuation pattern to get short again
Note
Stop sell order @ 69.12SL @ 71.36
Will implement trend follow strategy
Trade active
Short 69.54 @ MarketSL 71.77
Trend follow model for trade management
We are a day away from the month close, If we are still below 70 by close tomorrow, cannot see price meandering at those levels
Note
Happy with that monthly closeNote
Stop @ 71.43Note
We had a strong monthly close below $70 but the price back above $70 and the bollinger bands squeezing is making me nervousNote
Stop moved to 71.02Note
Stop moved to 70.56Note
Stop @ 70.20Trade closed: stop reached
Out on the pop above 70Disclaimer
The information and publications are not meant to be, and do not constitute, financial, investment, trading, or other types of advice or recommendations supplied or endorsed by TradingView. Read more in the Terms of Use.
Disclaimer
The information and publications are not meant to be, and do not constitute, financial, investment, trading, or other types of advice or recommendations supplied or endorsed by TradingView. Read more in the Terms of Use.