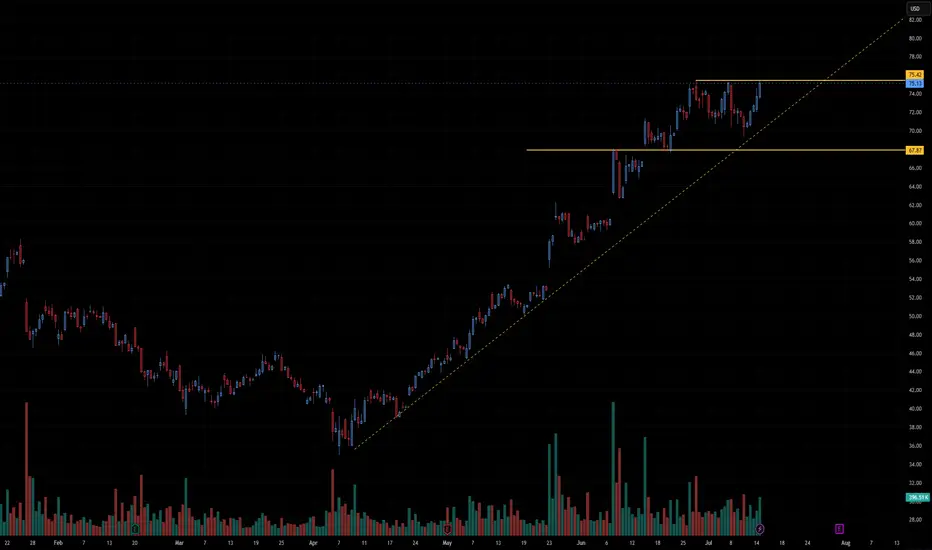
Cameco Corp. (CCJ) shows a strong uptrend with a consolidation just below resistance, which is a bullish technical pattern. Let’s break it down:
🔍 Technical Analysis of CCJ
1. Trend Structure
Clear uptrend: The stock has been making a series of higher highs and higher lows since March.
Ascending trendline (yellow dashed line): Price continues to respect this trendline as dynamic support, indicating sustained buying momentum.
2. Resistance Zone
Horizontal resistance at ~$75.42: This level has been tested multiple times but not yet convincingly broken.
The recent candles are testing this level again, showing pressure building. This increases the probability of a breakout.
3. Support Zone
Horizontal support at ~$67.87: This was the breakout level from a prior consolidation in early June and has acted as support since then.
Also aligns with the ascending trendline, forming a rising base—a sign of strength.
4. Volume Analysis
Volume has been picking up slightly during the current approach to resistance, but a significant spike in volume on a breakout would add strong confirmation.
Notably, there was strong volume during previous rallies—momentum buyers may be waiting for a confirmed breakout before re-entering.
✅ Bullish Scenario
A daily close above $75.42, ideally on above-average volume, could trigger a breakout with a target toward $80–82 in the near term.
The steep angle of the ascending trendline supports a continued rally if broader market conditions are favorable.
⚠️ Bearish/Neutral Scenario
If price fails to break above $75.42 and drops below the ascending trendline, look for a retest of the $67.87 level.
A break below that support could open the door for a deeper pullback toward the mid $60s.
🧠 Summary
CCJ is in a bullish consolidation pattern with strong support from a rising trendline and a flat-top resistance at ~$75.42. The setup resembles a classic ascending triangle, a continuation pattern that often resolves with a breakout in the direction of the prevailing trend (up).
Watch closely for:
A breakout candle above $75.42 with strong volume
Potential pullbacks toward the trendline for entries if breakout fails temporarily
Disclaimer
The information and publications are not meant to be, and do not constitute, financial, investment, trading, or other types of advice or recommendations supplied or endorsed by TradingView. Read more in the Terms of Use.
Disclaimer
The information and publications are not meant to be, and do not constitute, financial, investment, trading, or other types of advice or recommendations supplied or endorsed by TradingView. Read more in the Terms of Use.