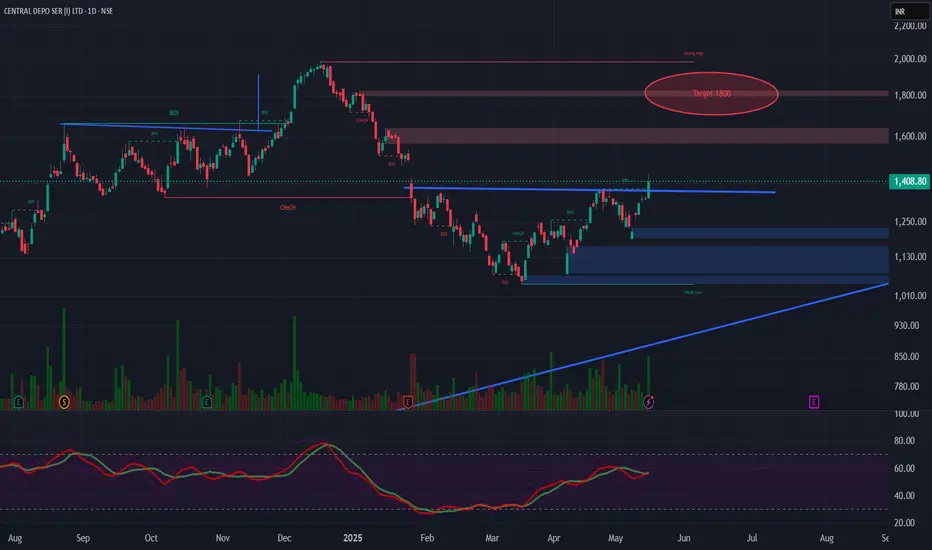
Technical Analysis:
Confirming the Breakouts:
Volume: It's crucial to assess if both breakouts were accompanied by a noticeable increase in trading volume. Strong volume adds conviction to the validity of the breakouts.
Sustainability: Monitor if the price holds above the breakout levels in the coming trading sessions.
Potential Upside:
Target (₹1800): Represents a potential upside of approximately 27.8% from the ₹1408.8 level (or around 26.9% from the ₹1417.00 closing price).
Quarterly and Yearly Results & EPS Comparison:
P/E Comparison:
Corporate Action:
Key Factors to Monitor:
- Current Price: ₹1408.8 (Note: Live prices can fluctuate. As of the market close on May 16, 2025, CDSL closed around ₹1417.00 on the NSE).
- Target: Your target of ₹1800 suggests a significant potential upside.
- Cup & Handle Pattern Breakout: This bullish continuation pattern, if confirmed, indicates potential for a strong upward move.
- Inverse Head & Shoulder Breakout: This is a bullish reversal pattern, suggesting the end of a downtrend and the start of an uptrend. The confluence of these two bullish patterns adds strength to the potential upside.
- Time Frame: A 1 to 3-month timeframe is reasonable for these patterns to play out, assuming the breakouts are sustained.
Confirming the Breakouts:
Volume: It's crucial to assess if both breakouts were accompanied by a noticeable increase in trading volume. Strong volume adds conviction to the validity of the breakouts.
Sustainability: Monitor if the price holds above the breakout levels in the coming trading sessions.
Potential Upside:
Target (₹1800): Represents a potential upside of approximately 27.8% from the ₹1408.8 level (or around 26.9% from the ₹1417.00 closing price).
Quarterly and Yearly Results & EPS Comparison:
- Latest Quarter Result (March 2025): CDSL reported a consolidated net profit of ₹100.31 Crore, a decrease of -22.4% compared to the same quarter last year (March 2024). The total income for the quarter was ₹255.78 Crore, a decrease of -4.34% YoY.
- Yearly Result (FY2025): For the full fiscal year ending March 2025, CDSL's total revenue stood at ₹984.58 Crore, a growth of 32.53% compared to the previous fiscal year (FY2024). The profit after tax for FY25 was ₹462.10 Crore, a growth of 27.19% YoY.
- EPS Comparison:
- Quarterly EPS (March 2025): ₹3.86, compared to ₹4.66 in March 2024.
- Yearly EPS (FY2025): ₹22.11, compared to ₹34.77 in FY2024. The yearly EPS shows a decrease despite revenue and profit growth, which could be due to an increase in the number of outstanding shares or other accounting adjustments.
P/E Comparison:
- Based on the closing price of ₹1417.00 and the TTM (Trailing Twelve Months) EPS of approximately ₹25.20, the current P/E ratio is around 56.23.
- Comparing this to peers like Computer Age Management Services (CAMS) with a P/E of around 43.73 and KFin Technologies with a P/E of around 55.97 (as of recent data), CDSL's P/E is in a similar range or slightly higher than some peers.
Corporate Action:
- Dividend: CDSL has declared a final dividend of ₹12.50 per share for the fiscal year ending March 31, 2025, subject to shareholder approval. The ex-dividend date and payment date will be announced later.
- In the quarter ending March 2024, CDSL declared a dividend of ₹3 per share.
Key Factors to Monitor:
- Breakout Confirmation: Watch for sustained price action above the breakout levels with good volume for both the Cup & Handle and Inverse Head & Shoulder patterns.
- Earnings Impact: Analyze how the market reacts to the recent quarterly and yearly results. While the yearly revenue and profit showed growth, the decrease in quarterly profit and yearly EPS might be a point of concern for some investors.
- Market Sentiment: Overall market sentiment and the performance of the financial services sector will influence CDSL's price.
- Dividend Announcement: Keep an eye on the record date and payment date for the declared dividend.
Related publications
Disclaimer
The information and publications are not meant to be, and do not constitute, financial, investment, trading, or other types of advice or recommendations supplied or endorsed by TradingView. Read more in the Terms of Use.
Related publications
Disclaimer
The information and publications are not meant to be, and do not constitute, financial, investment, trading, or other types of advice or recommendations supplied or endorsed by TradingView. Read more in the Terms of Use.