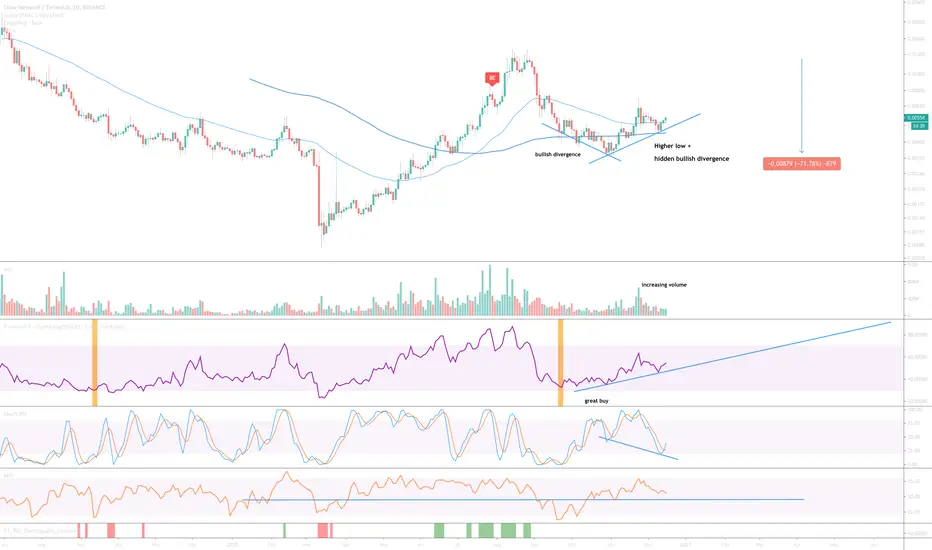
Following a near 70% correction since mid-August and oversold condition (orange column), the above 2-day chart is now indicating a reversal in price action is very probable.
On the same chart above there is Hidden bullish divergence between price action and the oscillators that follows a regular bullish divergence. In addition volume is seen to be increasing alongside the divergence.
Looking left on the on the 4-day chart below previous price action resistance is broken as the above hidden bullish divergence forms - very bullish.
1st target 16 cents / 200%
Trade active
Price action drop to support, tested, and was confirmed.Trade active
Hidden bullish divergence confirmed. Price action breaks through the 300-day moving average (green line).Trade active
First price action crosses through the 2-day 300-day moving average and then finds support on it - very bullish!Trade active
What an amazing close to the week. Why? A long tailed Dragonfly DOJI printed on the weekly chart below with price action on both the 21-week and 50-week moving averages. As good as it gets - expecting a strong move to the upside from here.Note
Price action finds strong support on the 600-day moving average (Red line) - very bullish.Note
10-day chart looks amazingTrade active
Price action breaks out of 600-day long resistance on the weekly (circled in orange). Price action resistance is in discovery mode once the previous high @ 2 cents is reached.Note
1100% in under 3-months. Take that BTC.Price action is becoming overbought as shown on the daily chart below. Sure price action could increase further however probability is no longer on your side.
Trade active
Very nice support off the 21-week EMA (yellow line) while RSI support is respected.Keep holding.
Note
Look for long entries between 2 to 2.5 cents (circled in Green).This next wave up will be the last before 1-3 months of correction.
Trade active
Arrived at 2 / 2.5 cents, very probable price action is now at the end of wave 4On the 2-day chart below price lands on the 200-day EMA - look left.
(remember 2-day chart so really 400 days)
Trade active
Now up 2000% - awesome. Wave 4 support was bang on (see above).Currently in wave 5 - where is the top? No idea but if you're sitting on 2000% of gain you should certainly be taking the initial investment off the table.
Note
one possible area to look for a top is around 30 to 40 cents.Note
Be very careful if you're still long on this one. Bearish divergence is very evident.Can price action keep moving up? Sure.
Is it probable? No. A 'great sell' alert is now printing on the weekly in line with the divergence.
BTC
bc1q2eckdzh0q8vsd7swcc8et6ze7s99khhxyl7zwy
Weblink: patreon.com/withoutworries
Allow 3-6 months on ideas. Not investment advice. DYOR
bc1q2eckdzh0q8vsd7swcc8et6ze7s99khhxyl7zwy
Weblink: patreon.com/withoutworries
Allow 3-6 months on ideas. Not investment advice. DYOR
Disclaimer
The information and publications are not meant to be, and do not constitute, financial, investment, trading, or other types of advice or recommendations supplied or endorsed by TradingView. Read more in the Terms of Use.