Updated
$CELR
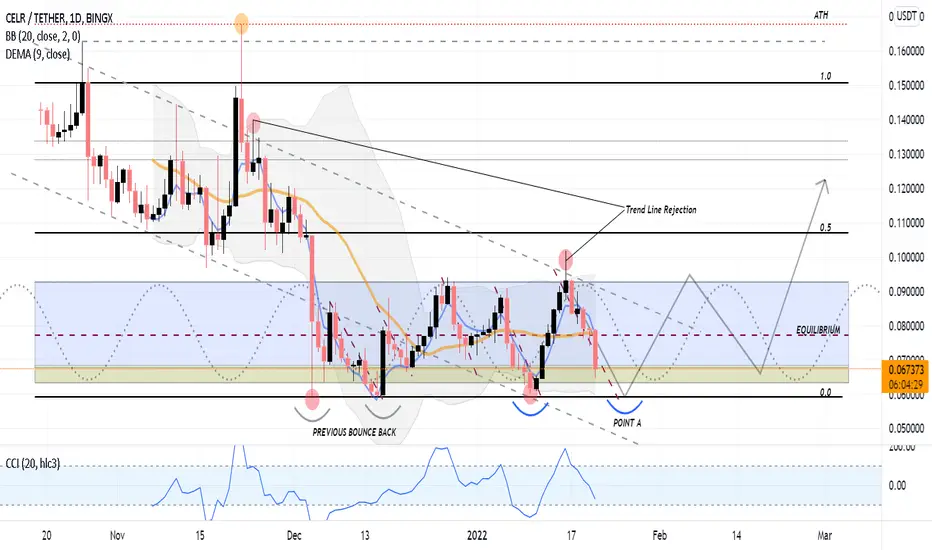
Looks like a Double Bottom pattern coming in.
Possible scenarios : - IMO
1. Either it might touch the Point A & might further move up to get
rejected along the Trend Line & follows Sine Wave and gets accumulated in the blue Zone (It had done the same pattern Previously).
2. It might break down 0.0 Lvl and enters completely bearish & would await for a Huge Volume to certainly break the trend line
& might move towards the ATH .
Scenario 1 Could possibly have two more sub scenes :
1.1) Since it has entered the Yellow Zone (it may go touch the 0.0 Lvl )., It might see a minor pump breaking the Equilibrium and march towards the Blue zone Top.
1.2) It might pick up a heavy VMA., to break all resistance ( Trend Line , Equilibrium, Blue Zone Top)., only to reach the 0.5 Lvl .
$CELR could be considered to be a perfect buy (Spot) ., if it just pulls back at 0.0 Lvl by a minimum of +10%.
Happy trading
Trade closed: stop reached
$CELR Making new lows and oscillations Trading Closed.
Disclaimer
The information and publications are not meant to be, and do not constitute, financial, investment, trading, or other types of advice or recommendations supplied or endorsed by TradingView. Read more in the Terms of Use.
Disclaimer
The information and publications are not meant to be, and do not constitute, financial, investment, trading, or other types of advice or recommendations supplied or endorsed by TradingView. Read more in the Terms of Use.