Hello?
Traders, welcome.
If you "Follow", you can always get new information quickly.
Please also click "Boost".
Have a good day.
-------------------------------------
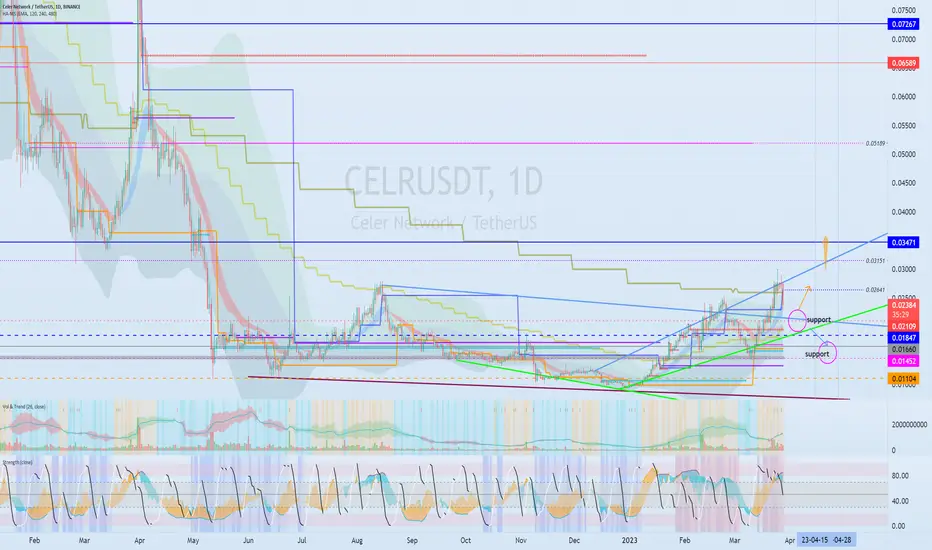
(CELRUSDT chart)

(1W chart)

It is the convergence of the HA-Low and HA-HIgh indicators.
Therefore, the key is whether it can rise with support around 0.02109.
Even if it does not rise above the M-Signal of the 1M chart, it is expected to rise soon if it moves sideways because the Bollinger Bands are contracting.
(1D chart)
If it rises above 0.03471, it is expected to show a full-fledged uptrend.
thus,
1st: 0.02109
2nd: 0.01452-0.01660
You need to make sure that it is supported near the 1st and 2nd order and can rise more than 0.02641.
-------------------------------------------------- -------------------------------------------
** All descriptions are for reference only and do not guarantee profit or loss in investment.
** Even if you know other people's know-how, it takes a considerable period of time to make it your own.
** This is a chart created with my know-how.
---------------------------------
Traders, welcome.
If you "Follow", you can always get new information quickly.
Please also click "Boost".
Have a good day.
-------------------------------------
(CELRUSDT chart)
(1W chart)
It is the convergence of the HA-Low and HA-HIgh indicators.
Therefore, the key is whether it can rise with support around 0.02109.
Even if it does not rise above the M-Signal of the 1M chart, it is expected to rise soon if it moves sideways because the Bollinger Bands are contracting.
(1D chart)
If it rises above 0.03471, it is expected to show a full-fledged uptrend.
thus,
1st: 0.02109
2nd: 0.01452-0.01660
You need to make sure that it is supported near the 1st and 2nd order and can rise more than 0.02641.
-------------------------------------------------- -------------------------------------------
** All descriptions are for reference only and do not guarantee profit or loss in investment.
** Even if you know other people's know-how, it takes a considerable period of time to make it your own.
** This is a chart created with my know-how.
---------------------------------
Other content (coins, stocks, etc.) is frequently posted on X.
X에 다른 내용(코인, 주식 등)이 자주 게시.
◆ t.me/readCryptoChannel
[HA-MS Indicator]
bit.ly/3YxHgvN
[OBV Indicator]
bit.ly/4dcyny3
X에 다른 내용(코인, 주식 등)이 자주 게시.
◆ t.me/readCryptoChannel
[HA-MS Indicator]
bit.ly/3YxHgvN
[OBV Indicator]
bit.ly/4dcyny3
Related publications
Disclaimer
The information and publications are not meant to be, and do not constitute, financial, investment, trading, or other types of advice or recommendations supplied or endorsed by TradingView. Read more in the Terms of Use.