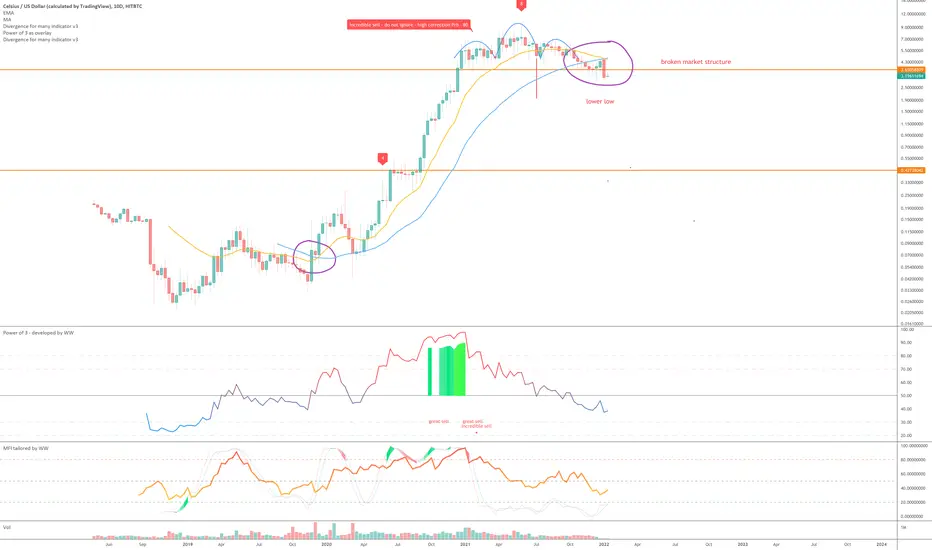
On the above 10-day chart price action has appreciated 15000% in the last 22 months. Had thought there was more, however a significant break of market structure says otherwise, we can’t ignore that.
Beyond the break of market structure the 21-week EMA (yellow line has just crossed down the 50-week EMA (blue line), this is extraordinarily bearish. The same was true in reverse when they crossed up, look left.
Lastly the Gaussian channel on the 4-day chart (below). Price action just fell out the bottom of the channel following a change to bearish colour, red. Nothing ever good will happen when price action falls out the bottom of the channel on this time frame.
Is it possible price action continue to move up? Sure.
Is it probable? No.
A sell from $3.50 is amazing but super risky.
Targets? $2 for starters once the head and shoulders neckline was broken. Beyond that 47 cents is the next level to offer support.
Good luck!
WW
4-day chart - Price action falls out of Gaussian channel bottom.
Trade closed: target reached
$2 target reached. A 'incredible buy' printed on the 2-day chart below about a week ago.The 2-day death cross means price action is very much in a bear market. This buy signal could just be a rally to resistance, which is around $4.70.
Trade active
A rally to resistance was observed with a perfect rejection from the 21-week EMA.No support until 40 cents.
Note
There's a bullish divergence on the 1-day chart with 'incredible buy' signal.This 'short' idea will be void once price action is above $4 and holding.
Giving there's an 'incredible buy' signal, it might be a excellent time to Dollar Cost Average in.
Trade closed: target reached
Boom target acquired.Trade active
Note
Looks like price action is heading to the next target area (blue line) at 14 cent area.The RSI resistance remains intact, which is projected to continue through until October.
BTC
bc1q2eckdzh0q8vsd7swcc8et6ze7s99khhxyl7zwy
Weblink: patreon.com/withoutworries
Allow 3-6 months on ideas. Not investment advice. DYOR
bc1q2eckdzh0q8vsd7swcc8et6ze7s99khhxyl7zwy
Weblink: patreon.com/withoutworries
Allow 3-6 months on ideas. Not investment advice. DYOR
Disclaimer
The information and publications are not meant to be, and do not constitute, financial, investment, trading, or other types of advice or recommendations supplied or endorsed by TradingView. Read more in the Terms of Use.