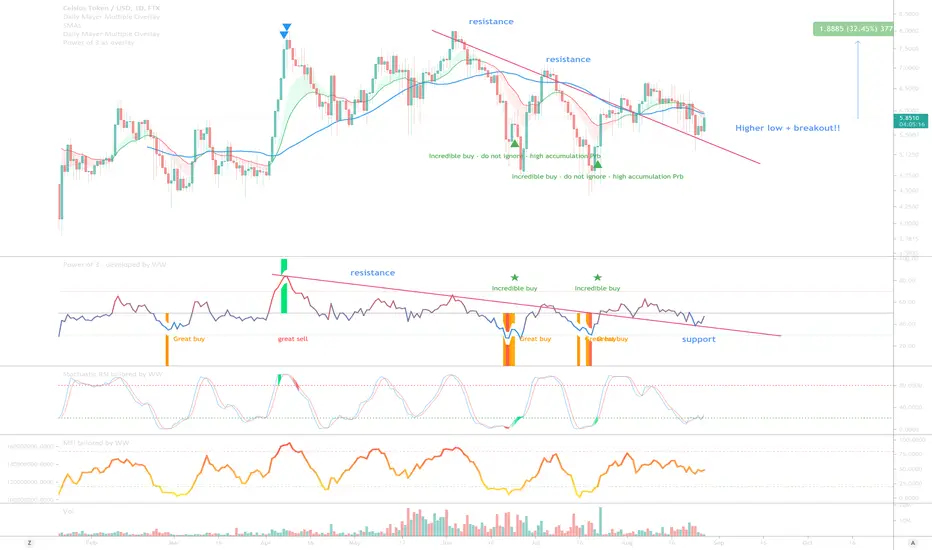
On the above 1-day chart price action breaks out of resistance following a 40% correction that began in early June. A number of reasons now exist to be bullish. They include:
1) RSI resistance becomes support following the ‘Incredible buy’ signals. Those signals indicate there is a high degree of probability of an upside move.
2) Price action prints a higher low on the 0.618 golden ratio.
3) The more exciting bullish case is on the 10-day chart (below). Price action has been struggling since the start of the year at $5.62. Something significant occurred in the last month.
3a) Price action came down to the annual EMA (green line) and confirmed as support.
3b) A Dragonfly fly DOJI / hammer candle was printed. On the 10-day chart. This shows support for this level is very strong. This candle was printed on the other side of resistance!!
3c) Stochastic RSI crosses up 20 following an extended period since the 80 cross down. Excellent.
1st target $7.60
2nd target $12
3rd target - working on it…
Good luck!
WW
The 10-day chart.
Trade active
This might be of interest…On the 1-day chart the ‘Lux Algo’ indicator is printing a cluster of ‘buy’ signals around the 1-year EMA (green line). Although I prefer my own ‘great buy’ signal it is interesting to see confluence.
A few folks have been mentioning the Lux Algo indicator so I went ahead and bought it to see what all the fuss is about.. looks interesting, will take a while to digest.
With regards to wether price action holds, the 8hr chart prints a ‘incredible buy’ signal with multiple dragonfly DOJI candles. I’d say it is very likely to be a hold!
1-day chart
8hr chart
Note
Price action on the weekly $ and Bitcoin charts now on the golden ratio.. perfect.Trade active
Opportunities springing up all over the place. This lends to the idea you don't need to have a large portfolio of different tokens. Six is more than enough, ten is too many!On the 8hr chart divergences are growing in number. 10 is redonkulous. Look left. Think of it like a spring, the higher the number the more compressed the spring.
Note
One way or another something interesting is going to happen to price action before by the month end. Look left.. Trade active
Strong breakout today amidst multiple bullish engulfing candlesNote
The 1st target is updated to $9.20 rather than $12.The 2nd target then becomes ~$50 once $9.20 is confirmed as support.
Trade active
Note
This trade is void should price action fall below $4.80 for a considerable length of time (days). Broken market structure.Note
Currently market structure is broken. Take notice of the comment above.BTC
bc1q2eckdzh0q8vsd7swcc8et6ze7s99khhxyl7zwy
Weblink: patreon.com/withoutworries
Allow 3-6 months on ideas. Not investment advice. DYOR
bc1q2eckdzh0q8vsd7swcc8et6ze7s99khhxyl7zwy
Weblink: patreon.com/withoutworries
Allow 3-6 months on ideas. Not investment advice. DYOR
Disclaimer
The information and publications are not meant to be, and do not constitute, financial, investment, trading, or other types of advice or recommendations supplied or endorsed by TradingView. Read more in the Terms of Use.
BTC
bc1q2eckdzh0q8vsd7swcc8et6ze7s99khhxyl7zwy
Weblink: patreon.com/withoutworries
Allow 3-6 months on ideas. Not investment advice. DYOR
bc1q2eckdzh0q8vsd7swcc8et6ze7s99khhxyl7zwy
Weblink: patreon.com/withoutworries
Allow 3-6 months on ideas. Not investment advice. DYOR
Disclaimer
The information and publications are not meant to be, and do not constitute, financial, investment, trading, or other types of advice or recommendations supplied or endorsed by TradingView. Read more in the Terms of Use.