Hello Traders,
Let's talk about Gold. Here is what I see for its next moves.
I use these tools to help me:
EMA (Exponential Moving Average)
Fib Ret. & Ext. (Fibonacci Retracement and Extension)
VWAP (Volume Weighted Average Price)
Volume Profile
RSI (Relative Strength Index)
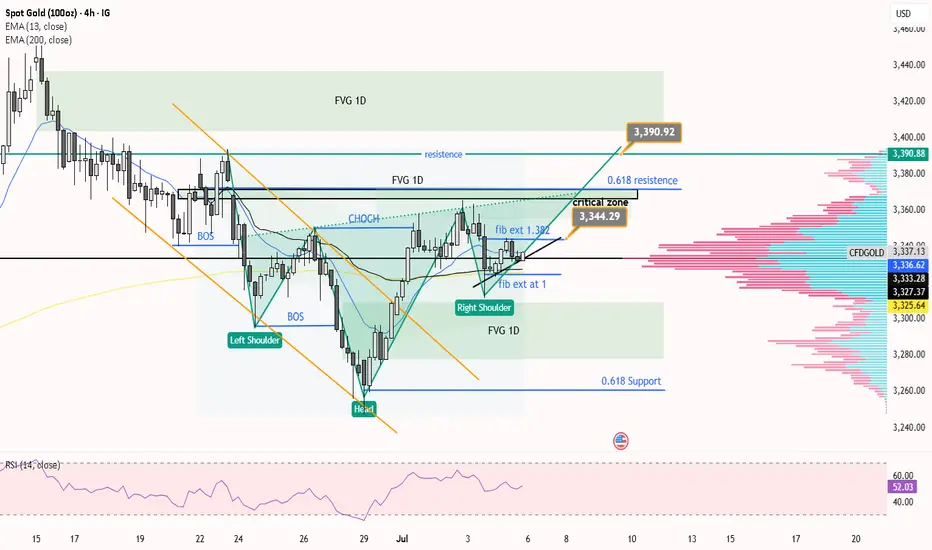
Looking at the big picture, it looks bullish for Gold. I see an inverse head and shoulders pattern forming. Also, the EMA and VWAP are below the price, which is a bullish sign. Gold also broke out of falling wedges and then moved back a little (a retracement), which is another bullish signal.
There is an important area I call the critical zone. This zone is between $3344 and $3364. It's important because it has a Fibonacci extension (between 2 and 1.618), a small FVG (Fair Value Gap) from the 1-day chart, and a resistance level from the 4-hour chart (at 0.618). This critical zone is important on both the 1-hour and 4-hour charts.
My idea is this: If the price of Gold goes above $3344, we can expect it to move higher into that critical zone, maybe up to $3364.
But, if you look very closely, there is also an ascending triangle pattern. This means we need to wait. It's best to wait until the price clearly breaks out (moves up strongly) or breaks down (moves down strongly) from this triangle before you open any trade.
Fundamental analysis:
FOMC Meeting Minutes (July 9):
Impact on Gold: Stronger (less rate cut chance) = Negative/Neutral for Gold. Weaker (more rate cut chance) = Positive for Gold. Volatility expected.
Trump's Tariff Deadline & Announcement (July 9 onwards):
Impact on Gold: New/higher tariffs = Strongly Positive for Gold (safe haven demand). This is the biggest risk/opportunity.
US Dollar ($) Trend:
Impact on Gold: US Dollar is downtrending = Positive for Gold.
US Bond Yields:
Impact on Gold: If yields fall = Positive for Gold. If yields stay high/rise = Neutral/Negative for Gold, but other factors (tariffs, central bank buying) might reduce this negative impact.
Let's talk about Gold. Here is what I see for its next moves.
I use these tools to help me:
EMA (Exponential Moving Average)
Fib Ret. & Ext. (Fibonacci Retracement and Extension)
VWAP (Volume Weighted Average Price)
Volume Profile
RSI (Relative Strength Index)
Looking at the big picture, it looks bullish for Gold. I see an inverse head and shoulders pattern forming. Also, the EMA and VWAP are below the price, which is a bullish sign. Gold also broke out of falling wedges and then moved back a little (a retracement), which is another bullish signal.
There is an important area I call the critical zone. This zone is between $3344 and $3364. It's important because it has a Fibonacci extension (between 2 and 1.618), a small FVG (Fair Value Gap) from the 1-day chart, and a resistance level from the 4-hour chart (at 0.618). This critical zone is important on both the 1-hour and 4-hour charts.
My idea is this: If the price of Gold goes above $3344, we can expect it to move higher into that critical zone, maybe up to $3364.
But, if you look very closely, there is also an ascending triangle pattern. This means we need to wait. It's best to wait until the price clearly breaks out (moves up strongly) or breaks down (moves down strongly) from this triangle before you open any trade.
Fundamental analysis:
FOMC Meeting Minutes (July 9):
Impact on Gold: Stronger (less rate cut chance) = Negative/Neutral for Gold. Weaker (more rate cut chance) = Positive for Gold. Volatility expected.
Trump's Tariff Deadline & Announcement (July 9 onwards):
Impact on Gold: New/higher tariffs = Strongly Positive for Gold (safe haven demand). This is the biggest risk/opportunity.
US Dollar ($) Trend:
Impact on Gold: US Dollar is downtrending = Positive for Gold.
US Bond Yields:
Impact on Gold: If yields fall = Positive for Gold. If yields stay high/rise = Neutral/Negative for Gold, but other factors (tariffs, central bank buying) might reduce this negative impact.
Note
Analysis failed. SL hit.Disclaimer
The information and publications are not meant to be, and do not constitute, financial, investment, trading, or other types of advice or recommendations supplied or endorsed by TradingView. Read more in the Terms of Use.
Disclaimer
The information and publications are not meant to be, and do not constitute, financial, investment, trading, or other types of advice or recommendations supplied or endorsed by TradingView. Read more in the Terms of Use.