Canopy Growth Corp. engages in the production and sale of medical cannabis.
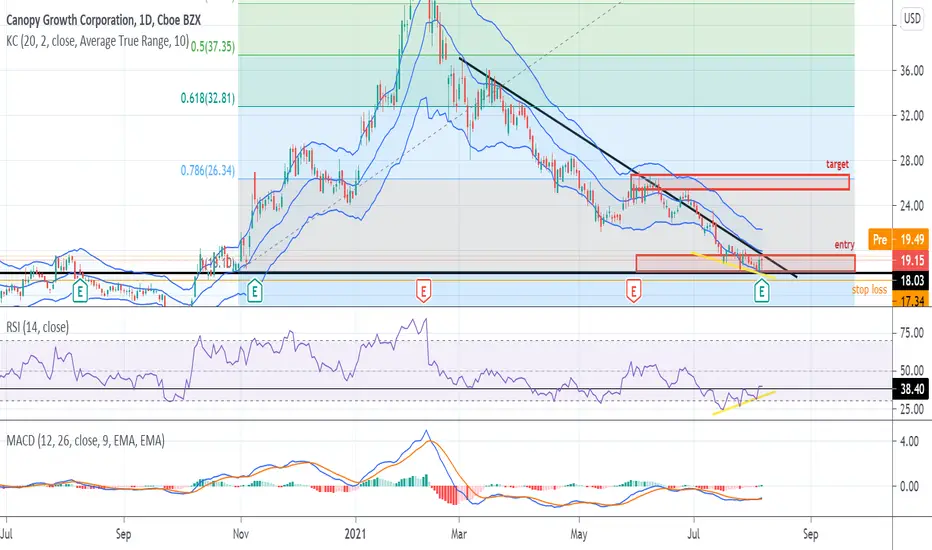
In the recent period, we can observe a descending triangle pattern as well as a downtrend.
Last days, stocks reached the bottom-line of the Keltner channel.
Fibonacci retracement pattern was used to indicate targets.
The RSI shows a bullish divergence.
According to the MACD, we see a bullish confirmation hence the trend should move upwards. Also, the MACD line is located below the zero line, indicating the market is oversold.
Conclusion:
Position: LONG
Entry range: $ 18.04 - $ 19.56
Target range: $ 25.34 - $ 26.68
Stop loss: $ 17.34
NO financial advice
💥 Free signals and ideas ➡ t.me/vfinvestment
Disclaimer
The information and publications are not meant to be, and do not constitute, financial, investment, trading, or other types of advice or recommendations supplied or endorsed by TradingView. Read more in the Terms of Use.
💥 Free signals and ideas ➡ t.me/vfinvestment
Disclaimer
The information and publications are not meant to be, and do not constitute, financial, investment, trading, or other types of advice or recommendations supplied or endorsed by TradingView. Read more in the Terms of Use.