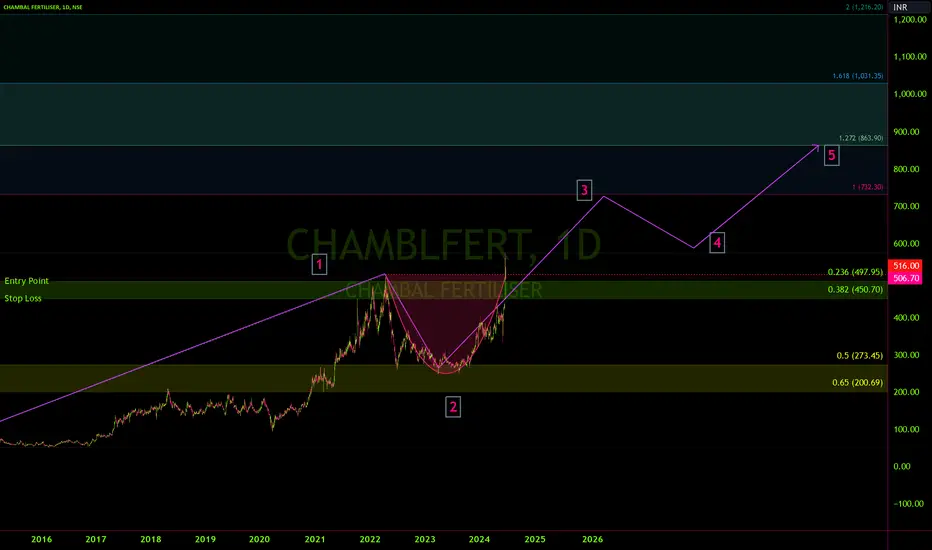
CHAMBAL Fertiliser on a daily time frame
CUP chart pattern
Monthly and Weekly RSI above 60 levels
Daily, 75 mins and 15 mins RSI declining
It should retrace the neckline levels to retest the levels.
If you calculate the retracement, it should retrace between 23.6 to 38.2%.
You can notice unusual volume on a break-out candle.
CUP chart pattern
Monthly and Weekly RSI above 60 levels
Daily, 75 mins and 15 mins RSI declining
It should retrace the neckline levels to retest the levels.
If you calculate the retracement, it should retrace between 23.6 to 38.2%.
You can notice unusual volume on a break-out candle.
Disclaimer
The information and publications are not meant to be, and do not constitute, financial, investment, trading, or other types of advice or recommendations supplied or endorsed by TradingView. Read more in the Terms of Use.
Disclaimer
The information and publications are not meant to be, and do not constitute, financial, investment, trading, or other types of advice or recommendations supplied or endorsed by TradingView. Read more in the Terms of Use.