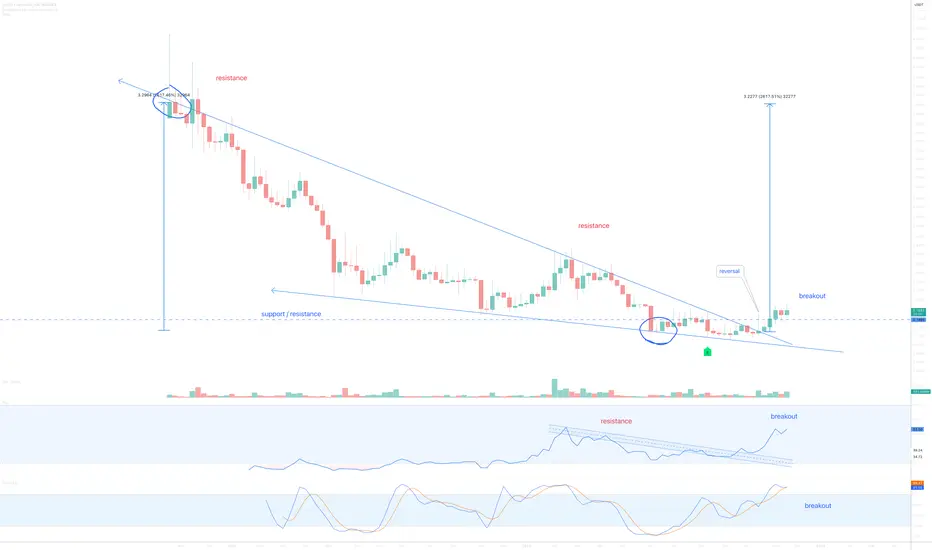
On the above weekly chart price action has corrected 96% since late 2021. A number of reasons now exist to consider a long position, including:
1) Price action and RSI resistance breakouts.
2) Support and resistance. Price action prints multiple weekly candles on past resistance. Oh yes.
3) Regular bullish divergence. Multiple oscillators print positive divergence with price action as measured over a one month period. This includes money flow.
4) The falling wedge forecasts a 2600% move from the breakout point as measured from the lowest and highest touch-points (blue circles).
Is it possible price action corrects further? Sure.
Is it probable? No.
Ww
Type: Trade
Risk: <=6%
Timeframe for long: Yesterday
Return: 20-25x
Trade active
Next resistance is around 40 cents and then $3Note
Past resistance confirms support.Note
Someone ask about this one... Daily chart looks very ugly at the moment.BTC
bc1q2eckdzh0q8vsd7swcc8et6ze7s99khhxyl7zwy
Weblink: patreon.com/withoutworries
Allow 3-6 months on ideas. Not investment advice. DYOR
bc1q2eckdzh0q8vsd7swcc8et6ze7s99khhxyl7zwy
Weblink: patreon.com/withoutworries
Allow 3-6 months on ideas. Not investment advice. DYOR
Disclaimer
The information and publications are not meant to be, and do not constitute, financial, investment, trading, or other types of advice or recommendations supplied or endorsed by TradingView. Read more in the Terms of Use.
BTC
bc1q2eckdzh0q8vsd7swcc8et6ze7s99khhxyl7zwy
Weblink: patreon.com/withoutworries
Allow 3-6 months on ideas. Not investment advice. DYOR
bc1q2eckdzh0q8vsd7swcc8et6ze7s99khhxyl7zwy
Weblink: patreon.com/withoutworries
Allow 3-6 months on ideas. Not investment advice. DYOR
Disclaimer
The information and publications are not meant to be, and do not constitute, financial, investment, trading, or other types of advice or recommendations supplied or endorsed by TradingView. Read more in the Terms of Use.