📌 Chart Pattern: Triple Bottom with Trendline Breakout
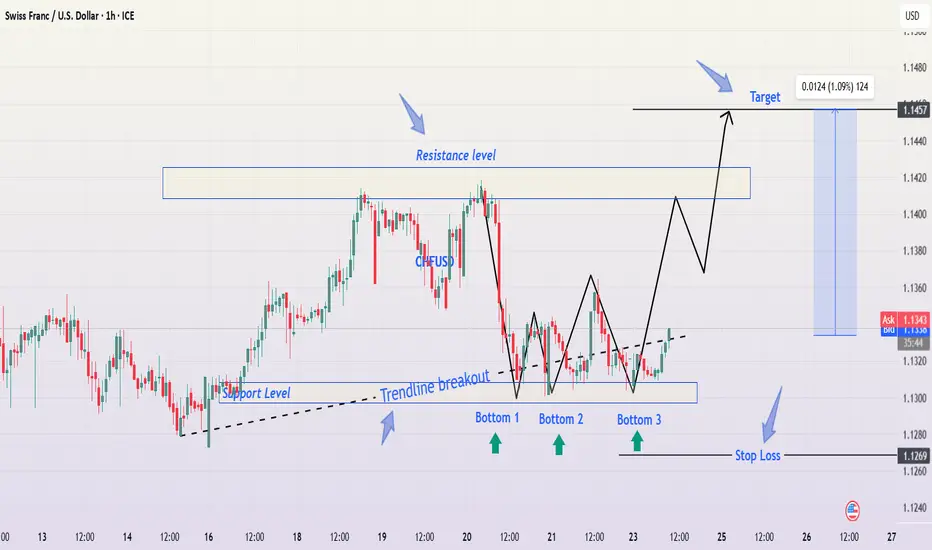
This CHF/USD chart showcases a triple bottom formation, a bullish reversal pattern that signals a potential uptrend after three consecutive lows at a strong support level. The price action respects this support zone and attempts a trendline breakout, suggesting a shift in momentum from bearish to bullish.
📊 Full Chart Breakdown & Professional Analysis
1️⃣ Key Levels & Structure:
✅ Support Level (1.1300 - 1.1270):
The price has tested this region three times, indicating strong buying interest.
This forms a triple bottom, a reliable reversal pattern in technical analysis.
✅ Resistance Zone (1.1400 - 1.1420):
The price previously reversed from this zone, making it a key short-term resistance level.
✅ Target Level (1.1457):
A breakout above resistance could drive the price toward this measured move target, representing a 1% potential gain.
✅ Stop Loss (1.1269):
Placed below the support zone to minimize risk in case of a breakdown.
2️⃣ Price Action & Trendline Breakout:
📌 Triple Bottom Formation:
Price hits the same support level three times, signaling strong demand.
Each bounce from support indicates a gradual weakening of bearish momentum.
📌 Trendline Breakout:
The price broke a downward-sloping trendline, suggesting a potential bullish move.
A successful retest of the trendline could confirm further upside.
📌 Expected Move:
Scenario 1: Price confirms the breakout, retests, and moves toward resistance.
Scenario 2: If resistance is broken, price targets the next major level at 1.1457.
3️⃣ Trading Strategy – How to Trade This Setup?
🎯 Buy Entry:
Enter long after a confirmed breakout and retest of the trendline.
📉 Stop Loss:
Below 1.1269 (beneath triple bottom support) to limit downside risk.
🎯 Take Profit Targets:
Target 1: 1.1400 (Resistance Area)
Target 2: 1.1457 (Measured Move Projection)
💡 Risk-Reward Ratio:
Favorable risk-reward ratio of 1:3, making it an attractive setup for traders.
4️⃣ Market Psychology Behind This Move:
Bears losing strength: Multiple failed attempts to break support indicate sellers are exhausted.
Bulls gaining momentum: Trendline breakout shows buyers are stepping in with confidence.
Breakout confirmation: If resistance breaks, a strong rally toward 1.1457 is likely.
📌 Summary: Bullish CHF/USD Trade Idea
🔹 Pattern: Triple Bottom + Trendline Breakout
🔹 Entry: Buy on retest confirmation
🔹 Stop Loss: 1.1269
🔹 Target: 1.1400 & 1.1457
🔹 Risk-Reward: Favorable 1:3 setup
🚀 This is a high-probability trade setup with strong technical confirmation, making it a great opportunity for breakout traders! 🚀
For Daily Trade Setups and Forecast: 📈 t.me/xauusdoptimizer
Premium Signals Fr33: 💯 t.me/xauusdoptimizer
🥰🥳🤩
Premium Signals Fr33: 💯 t.me/xauusdoptimizer
🥰🥳🤩
Related publications
Disclaimer
The information and publications are not meant to be, and do not constitute, financial, investment, trading, or other types of advice or recommendations supplied or endorsed by TradingView. Read more in the Terms of Use.