Market Overview: Bullish Reversal in CHF/USD
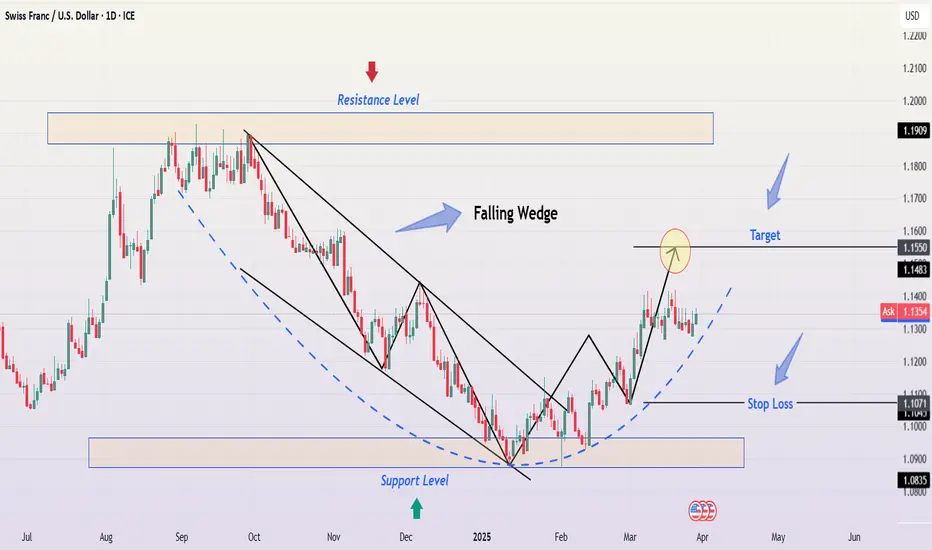
The Swiss Franc (CHF) / U.S. Dollar (USD) currency pair has recently broken out of a Falling Wedge pattern, signaling a bullish trend reversal. This breakout is significant as it suggests the end of a prolonged downtrend and the beginning of a new upward momentum. Traders who capitalize on this pattern could benefit from potential long opportunities.
This analysis will cover the chart pattern, key levels, trading setup, risk management, and market sentiment, providing a comprehensive professional breakdown of the CHF/USD price action.
1. Chart Pattern: Falling Wedge – Bullish Breakout
A Falling Wedge is a well-known bullish reversal pattern that forms when price action creates lower highs and lower lows, but the slope of the highs is steeper than the lows. This leads to a narrowing structure that suggests sellers are losing strength, paving the way for a bullish breakout.
Pattern Characteristics:
✔ Prior Downtrend: The CHF/USD pair was in a sustained bearish trend before forming the wedge.
✔ Converging Trendlines: Price action squeezed into a wedge formation, showing decreasing volatility.
✔ Breakout Confirmation: The price successfully broke above the wedge resistance, signaling a shift in market sentiment.
✔ Retest Possibility: Price may revisit the breakout zone before continuing its uptrend.
A breakout from a falling wedge typically leads to a sharp bullish rally, making this a high-probability trading opportunity.
2. Key Technical Levels: Support & Resistance
Support Zones (Buying Interest):
🔵 1.0835 – 1.1000: This zone has acted as strong support where buyers stepped in aggressively.
🔵 1.1071 – 1.1095: A short-term support level that aligns with recent price action, making it a critical stop-loss area.
Resistance Zones (Profit Targets):
🔴 1.1483 – 1.1550 (Primary Resistance): Price has struggled at this level previously, making it the first target for a bullish move.
🔴 1.1600 (Major Resistance): If the uptrend continues, this level will act as the next major challenge.
🔴 1.1909 (Extended Target): A long-term resistance level where price has historically reversed.
3. Trading Strategy & Entry Setup
Now that we have identified the breakout and key levels, let’s design a strategic trading plan.
📌 Entry Points for Long Trades:
✅ Aggressive Entry: Buy at the current price after the breakout, expecting continuation.
✅ Conservative Entry: Wait for a retest of the wedge breakout zone or support near 1.1071 – 1.1095 before entering long.
📌 Stop-Loss Placement (Risk Management):
❌ Stop below 1.1071: This level is a strong support area, and a break below it may invalidate the bullish setup.
❌ Alternative Stop below 1.1000: A safer option for long-term traders to avoid stop-hunting.
📌 Take-Profit Levels:
🎯 Target 1: 1.1483 – 1.1550 (Primary Resistance Zone)
🎯 Target 2: 1.1600 (Stronger resistance where partial profits can be booked)
🎯 Target 3 (Extended): 1.1909 (For swing traders holding positions longer)
📌 Risk-Reward Ratio:
A proper Risk-to-Reward (R:R) ratio of at least 1:2 should be followed for efficient trade management. This means:
Risking 50 pips to gain 100 pips (or more) for profitable trading.
4. Market Sentiment & Confirmation Signals
✔ RSI (Relative Strength Index):
Above 50? Bullish confirmation.
Near 70? Overbought zone, potential pullback.
✔ MACD (Moving Average Convergence Divergence):
Bullish Crossover? Strengthens buy signal.
Divergence? Confirms price momentum.
✔ Volume Analysis:
High volume on breakout? Confirms strong buying interest.
Low volume? Beware of false breakout.
✔ Fundamental Factors:
Swiss National Bank (SNB) Policy: If SNB maintains dovish policies, CHF could weaken, pushing CHF/USD higher.
US Federal Reserve Stance: A strong USD could slow CHF/USD gains.
5. Conclusion & Trading Plan
🔹 Summary of Trade Setup:
✅ Bullish breakout from Falling Wedge – high-probability long trade
✅ Retest of breakout zone may offer better entry
✅ Major support at 1.1000 – 1.1071
✅ Targeting 1.1550 – 1.1909 range
🚀 Final Trading Plan:
📌 Buy CHF/USD above 1.1100 – 1.1150
📌 Stop-loss below 1.1071
📌 Take Profit 1: 1.1550
📌 Take Profit 2: 1.1600
📌 Take Profit 3 (Swing Trade): 1.1909
📢 Pro Tip:
Always confirm breakout volume before entering.
Monitor economic events affecting CHF & USD.
Use proper risk management (1-2% of account per trade).
📊 Final Verdict:
🔥 CHF/USD is in a bullish setup after breaking out from a Falling Wedge. Traders should look for buy opportunities on pullbacks while targeting resistance levels. 🚀
For Daily Trade Setups and Forecast: 📈 t.me/xauusdoptimizer
Premium Signals Fr33: 💯 t.me/xauusdoptimizer
🥰🥳🤩
Premium Signals Fr33: 💯 t.me/xauusdoptimizer
🥰🥳🤩
Related publications
Disclaimer
The information and publications are not meant to be, and do not constitute, financial, investment, trading, or other types of advice or recommendations supplied or endorsed by TradingView. Read more in the Terms of Use.