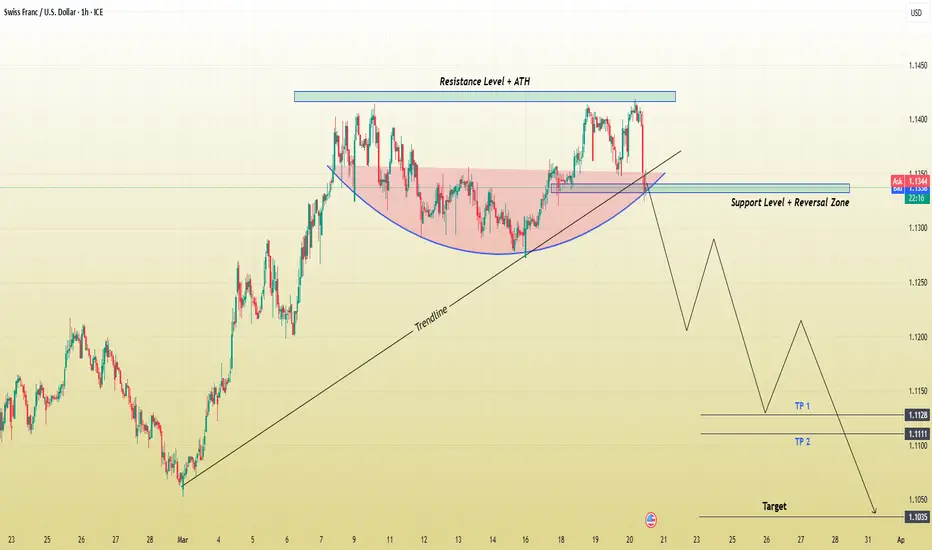
his CHF/USD (Swiss Franc/U.S. Dollar) 1-hour chart showcases a bearish trading setup, signaling a potential downside move after a failed breakout at a key resistance level. Below is a comprehensive breakdown of the chart, highlighting key technical elements, potential trade setups, and risk management considerations.
1. Identified Chart Pattern – Cup & Handle (Failed Breakout)
The chart initially formed a Cup and Handle pattern, a bullish continuation setup where:
The rounded bottom (cup) indicated accumulation and a gradual shift in trend from bearish to bullish.
The handle consolidation represented a minor pullback before a potential breakout.
However, the pattern failed to hold its bullish momentum. Instead of continuing higher, the price was rejected at the resistance level (ATH – All-Time High), signaling a shift in sentiment.
2. Key Technical Levels
Resistance Level + ATH (All-Time High)
The price reached a significant resistance zone (marked in blue), aligning with an all-time high (ATH) level.
Multiple rejections at this level indicate strong selling pressure, making it a potential distribution area where smart money is offloading positions.
Support Level + Reversal Zone
After rejection from the resistance, the price retraced to a critical support zone, previously acting as a demand area (buyers stepping in).
A break below this level confirms bearish momentum, increasing the likelihood of further downside movement.
Trendline Break – Bearish Confirmation
The trendline (marked in black) represents the primary uptrend support that guided price movement.
The break below this trendline signals a loss of bullish strength, increasing the probability of a trend reversal rather than a continuation.
3. Projected Price Movement – Bearish Scenario
Given the trendline break and rejection from resistance, the chart suggests a bearish wave with the following expectations:
A retest of the broken trendline and support zone before continuing downward.
Lower highs and lower lows formation – confirming a new downtrend.
A potential drop towards key downside targets (marked as TP1, TP2, and the final target).
Take Profit (TP) Targets:
✅ TP1 (1.1128): A minor support level where price may find temporary buying interest.
✅ TP2 (1.1111): A more significant support area that previously acted as demand.
✅ Final Target (1.1035): The ultimate downside objective, aligning with a major support zone and historical price action levels.
Stop-Loss Placement (SL):
📍 Above the broken trendline OR the recent swing high, ensuring protection against false breakouts or retracements.
4. Trade Execution & Risk Management
Entry Strategy (For Short Positions)
🔹 Aggressive Entry: Enter short immediately after the support zone break.
🔹 Conservative Entry: Wait for a retest of the support-turned-resistance area for confirmation before shorting.
Risk-Reward Ratio Consideration:
A properly placed stop-loss above resistance ensures a favorable risk-to-reward ratio.
Ideal ratio: 1:2 or better, meaning potential reward should be at least twice the risk.
5. Market Sentiment & Possible Alternative Scenario
While the primary outlook is bearish, traders must remain flexible and monitor price action closely:
If price reclaims the support zone and breaks above resistance, it invalidates the bearish setup, shifting momentum back to bullish.
A sustained close above the trendline could trap early sellers, leading to a short squeeze rally back toward resistance.
6. Final Thoughts
🔹 Bearish Bias: This setup favors downside movement due to trendline break, resistance rejection, and market structure shift.
🔹 Key Levels to Watch: Support zone retest, trendline confirmation, and target levels.
🔹 Risk Management is Essential: Using stop-loss protection and proper trade sizing to mitigate potential losses.
Conclusion: High-Probability Bearish Setup
🚀 The CHF/USD pair has shifted to a bearish structure after failing to break its ATH resistance. The breakdown of the trendline and key support level suggests a strong sell-off towards the 1.1035 target. Traders should look for short opportunities on pullbacks while managing risk effectively.
Would you like me to refine or simplify any part of this analysis for your TradingView post? 📉🔥
Related publications
Disclaimer
The information and publications are not meant to be, and do not constitute, financial, investment, trading, or other types of advice or recommendations supplied or endorsed by TradingView. Read more in the Terms of Use.
Related publications
Disclaimer
The information and publications are not meant to be, and do not constitute, financial, investment, trading, or other types of advice or recommendations supplied or endorsed by TradingView. Read more in the Terms of Use.