Hi i hope everyone is profitting in this market, today i wanted to bring up the cup and handdle spotted on chillguy with major upside that could go as high as ATH's if not higher but before you dive into what a cup and handle is on chillguy give me a like and follow if you found this content of value so others can more easily see it as well hping they gain knwledge of this as well.
Reistance
$0.11 key level for massive breakout
$0.20
The cup and handle pattern is a bullish continuation pattern used in technical analysis to identify potential buying opportunities in trading. Below is a concise explanation of the pattern and how to trade it:
**What is the Cup and Handle Pattern?**
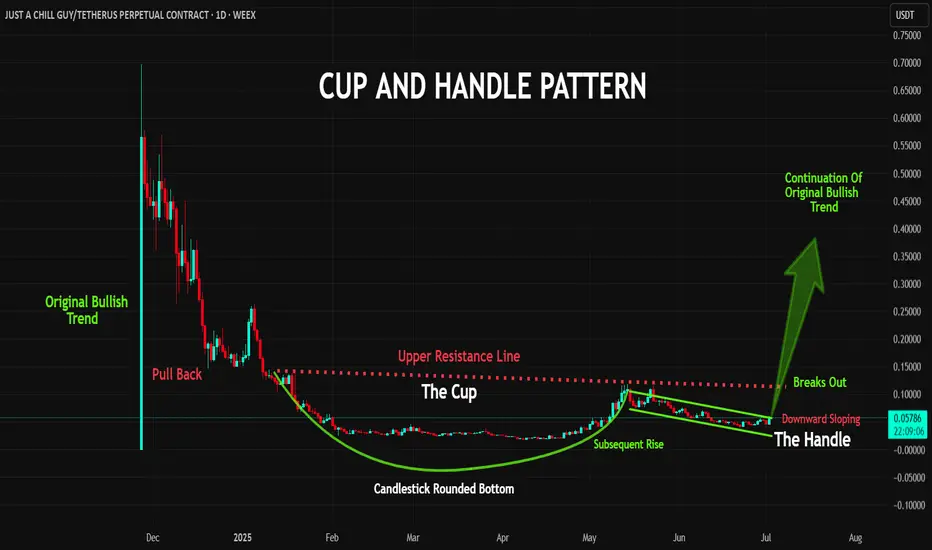
- **Shape**: The pattern resembles a "U" shape (the cup) followed by a smaller consolidation or pullback (the handle).
- **Cup**: Represents a period of price decline followed by a recovery to near the previous high, forming a rounded bottom.
- **Handle**: A short-term consolidation or slight pullback, often sloping downward, signaling a pause before a breakout.
- **Timeframe**: Can form over weeks to months on daily or weekly charts.
**Key Characteristics**
1. **Prior Uptrend**: The pattern typically forms after a significant price increase.
2. **Cup Depth**: The cup's lowest point is usually 20-50% below the prior high, though deeper cups can occur in volatile markets.
3. **Handle Formation**: The handle should slope downward and last shorter than the cup (e.g., 1-4 weeks). It often retraces 10-33% of the cup's height.
4. **Volume**: Volume typically decreases during the cup formation and handle, with a spike during the breakout.
**How to Trade the Cup and Handle**
1. **Identify the Pattern**:
- Confirm the cup's "U" shape with a rounded bottom (not a sharp "V").
- Ensure the handle forms a tight consolidation, ideally sloping downward.
- Check for a prior uptrend to confirm the bullish continuation context.
2. **Entry Point**:
- Enter a long position when the price breaks above the handle’s resistance (the high of the cup).
- Confirm the breakout with increased volume to reduce false signals.
3. **Stop-Loss**:
- Place a stop-loss below the handle’s low or the cup’s low, depending on risk tolerance (typically 5-10% below the entry).
4. **Price Target**:
- Measure the cup’s depth (from the high to the low) and add it to the breakout point.
- Example: If the cup’s high is $100, the low is $70, and the breakout is at $100, the target is $100 + ($100 - $70) = $130.
5. **Volume Confirmation**:
- Look for a volume surge during the breakout to validate the move.
- Weak volume may indicate a false breakout.
### **Risk Management**
- **Risk-Reward Ratio**: Aim for a minimum 2:1 ratio (e.g., risk $1 to gain $2).
- **Position Sizing**: Risk no more than 1-2% of your account per trade.
- **False Breakouts**: Be cautious of breakouts without volume or in choppy markets.
**Tips for Success**
- **Timeframes**: The pattern is more reliable on longer timeframes (daily or weekly charts).
- **Market Context**: Ensure the broader market trend supports the bullish pattern.
- **Combine Indicators**: Use tools like moving averages, RSI, or MACD to confirm momentum and avoid overbought conditions.
- **Practice**: Backtest the pattern on historical data or use a demo account to refine your strategy.
**Example**
- Stock XYZ rises from $50 to $100 (uptrend), forms a cup dropping to $70 and recovering to $100, then consolidates in a handle between $95-$100.
- Breakout occurs above $100 on high volume. Enter at $101, set a stop-loss at $94 (handle low), and target $130 (cup depth of $30 added to $100).
Reistance
$0.11 key level for massive breakout
$0.20
The cup and handle pattern is a bullish continuation pattern used in technical analysis to identify potential buying opportunities in trading. Below is a concise explanation of the pattern and how to trade it:
**What is the Cup and Handle Pattern?**
- **Shape**: The pattern resembles a "U" shape (the cup) followed by a smaller consolidation or pullback (the handle).
- **Cup**: Represents a period of price decline followed by a recovery to near the previous high, forming a rounded bottom.
- **Handle**: A short-term consolidation or slight pullback, often sloping downward, signaling a pause before a breakout.
- **Timeframe**: Can form over weeks to months on daily or weekly charts.
**Key Characteristics**
1. **Prior Uptrend**: The pattern typically forms after a significant price increase.
2. **Cup Depth**: The cup's lowest point is usually 20-50% below the prior high, though deeper cups can occur in volatile markets.
3. **Handle Formation**: The handle should slope downward and last shorter than the cup (e.g., 1-4 weeks). It often retraces 10-33% of the cup's height.
4. **Volume**: Volume typically decreases during the cup formation and handle, with a spike during the breakout.
**How to Trade the Cup and Handle**
1. **Identify the Pattern**:
- Confirm the cup's "U" shape with a rounded bottom (not a sharp "V").
- Ensure the handle forms a tight consolidation, ideally sloping downward.
- Check for a prior uptrend to confirm the bullish continuation context.
2. **Entry Point**:
- Enter a long position when the price breaks above the handle’s resistance (the high of the cup).
- Confirm the breakout with increased volume to reduce false signals.
3. **Stop-Loss**:
- Place a stop-loss below the handle’s low or the cup’s low, depending on risk tolerance (typically 5-10% below the entry).
4. **Price Target**:
- Measure the cup’s depth (from the high to the low) and add it to the breakout point.
- Example: If the cup’s high is $100, the low is $70, and the breakout is at $100, the target is $100 + ($100 - $70) = $130.
5. **Volume Confirmation**:
- Look for a volume surge during the breakout to validate the move.
- Weak volume may indicate a false breakout.
### **Risk Management**
- **Risk-Reward Ratio**: Aim for a minimum 2:1 ratio (e.g., risk $1 to gain $2).
- **Position Sizing**: Risk no more than 1-2% of your account per trade.
- **False Breakouts**: Be cautious of breakouts without volume or in choppy markets.
**Tips for Success**
- **Timeframes**: The pattern is more reliable on longer timeframes (daily or weekly charts).
- **Market Context**: Ensure the broader market trend supports the bullish pattern.
- **Combine Indicators**: Use tools like moving averages, RSI, or MACD to confirm momentum and avoid overbought conditions.
- **Practice**: Backtest the pattern on historical data or use a demo account to refine your strategy.
**Example**
- Stock XYZ rises from $50 to $100 (uptrend), forms a cup dropping to $70 and recovering to $100, then consolidates in a handle between $95-$100.
- Breakout occurs above $100 on high volume. Enter at $101, set a stop-loss at $94 (handle low), and target $130 (cup depth of $30 added to $100).
Disclaimer
The information and publications are not meant to be, and do not constitute, financial, investment, trading, or other types of advice or recommendations supplied or endorsed by TradingView. Read more in the Terms of Use.
Disclaimer
The information and publications are not meant to be, and do not constitute, financial, investment, trading, or other types of advice or recommendations supplied or endorsed by TradingView. Read more in the Terms of Use.