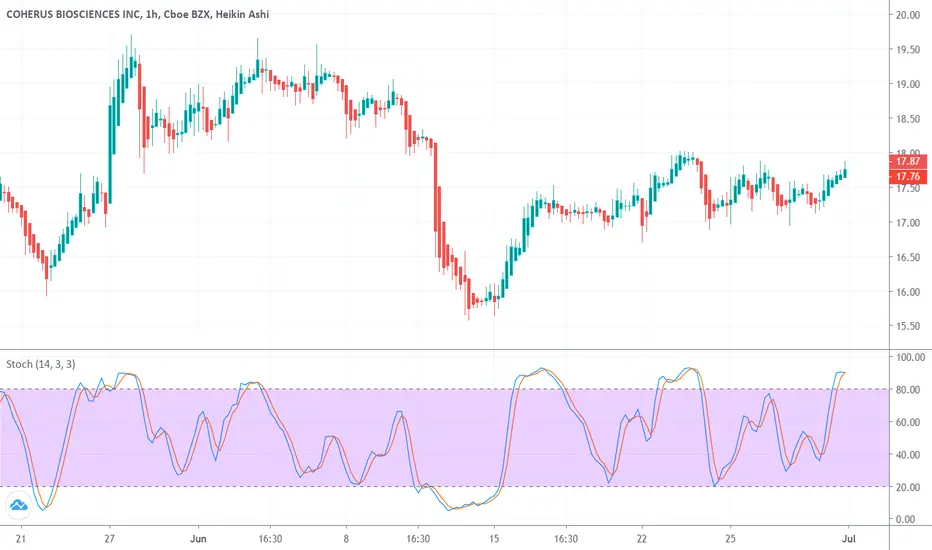
This is a signal that CHRS's price trend could be reversing, and it may be an opportunity to sell the stock or take a defensive position. Tickeron A.I.dvisor identified 61 similar cases where CHRS's stochastic oscillator exited the overbought zone, and 52 of them led to successful outcomes. Odds of Success: 85%.
Current price $17.86 crossed the resistance line at $17.45 and is trading between $19.50 support and $17.45 resistance lines. Throughout the month of 05/28/20 - 06/29/20, the price experienced a -4% Downtrend, while the week of 06/22/20 - 06/29/20 shows a +0.73% Uptrend.
Current price $17.86 crossed the resistance line at $17.45 and is trading between $19.50 support and $17.45 resistance lines. Throughout the month of 05/28/20 - 06/29/20, the price experienced a -4% Downtrend, while the week of 06/22/20 - 06/29/20 shows a +0.73% Uptrend.
Disclaimer
The information and publications are not meant to be, and do not constitute, financial, investment, trading, or other types of advice or recommendations supplied or endorsed by TradingView. Read more in the Terms of Use.
Disclaimer
The information and publications are not meant to be, and do not constitute, financial, investment, trading, or other types of advice or recommendations supplied or endorsed by TradingView. Read more in the Terms of Use.