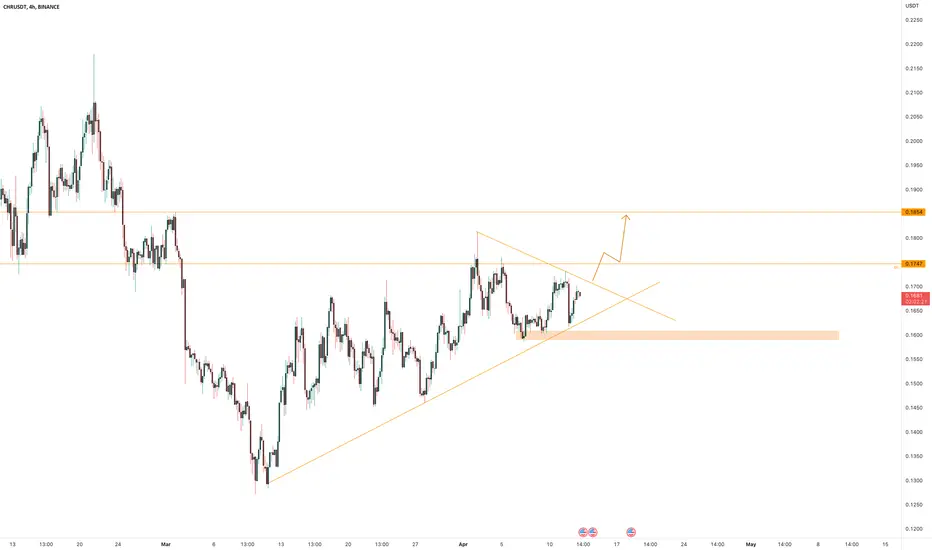
CHRUSDT is creating a pennant on the $0.17 area.
A pennant is a technical chart pattern that resembles a triangle. It's formed when there's a sharp move in the price of an asset, followed by a consolidation phase with converging trendlines. The pennant is typically characterized by decreasing trading volume and volatility as the price moves closer to the tip of the triangle. A clear breakout from the pennant pattern with significant volumes can be a strong indication of the direction of the next price move.
According to Plancton's Rules, if the price of CHRUSDT has a clear breakout with significant volumes from the pennant pattern on the $0.17 area, it may suggest a bullish trend. Traders could consider entering a new long position with the expectation of a continued uptrend.
Note
The price is following the arrow Note
12% Disclaimer
The information and publications are not meant to be, and do not constitute, financial, investment, trading, or other types of advice or recommendations supplied or endorsed by TradingView. Read more in the Terms of Use.
Disclaimer
The information and publications are not meant to be, and do not constitute, financial, investment, trading, or other types of advice or recommendations supplied or endorsed by TradingView. Read more in the Terms of Use.