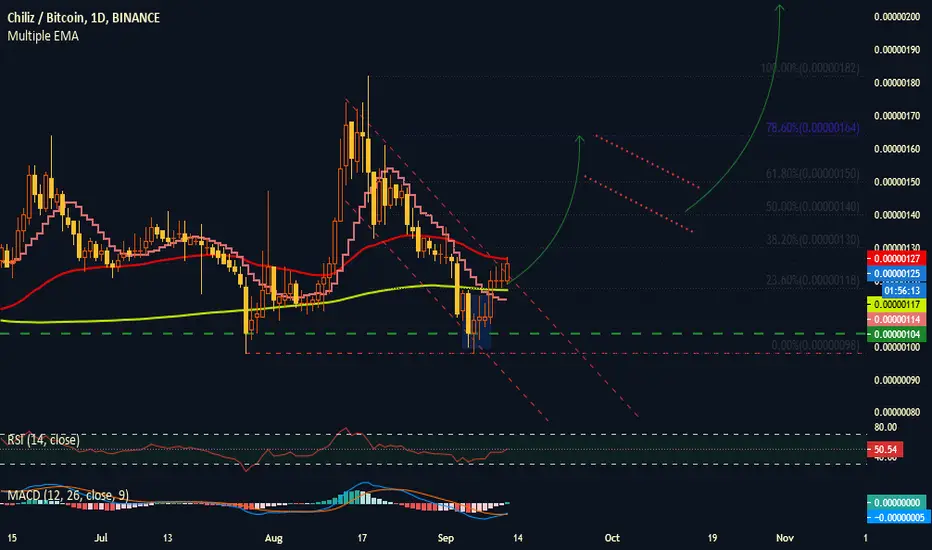
Two bullish reversal candlestick pattern side by each other: (Marked with blue light)
Indicators
price passing through two moving average 10 and 200 one next to other (Yellow200,lightred10;step line)
RSI crossing up 50 line strong and bullish
MACD breaks the signal line and switch to bullish with appears first green volume
This analysis have higher targets which available with patience
GOOD LUCK and Thanks for support.
- Tweezer bottom
- Spinning top
Indicators
price passing through two moving average 10 and 200 one next to other (Yellow200,lightred10;step line)
RSI crossing up 50 line strong and bullish
MACD breaks the signal line and switch to bullish with appears first green volume
This analysis have higher targets which available with patience
GOOD LUCK and Thanks for support.
Disclaimer
The information and publications are not meant to be, and do not constitute, financial, investment, trading, or other types of advice or recommendations supplied or endorsed by TradingView. Read more in the Terms of Use.
Disclaimer
The information and publications are not meant to be, and do not constitute, financial, investment, trading, or other types of advice or recommendations supplied or endorsed by TradingView. Read more in the Terms of Use.