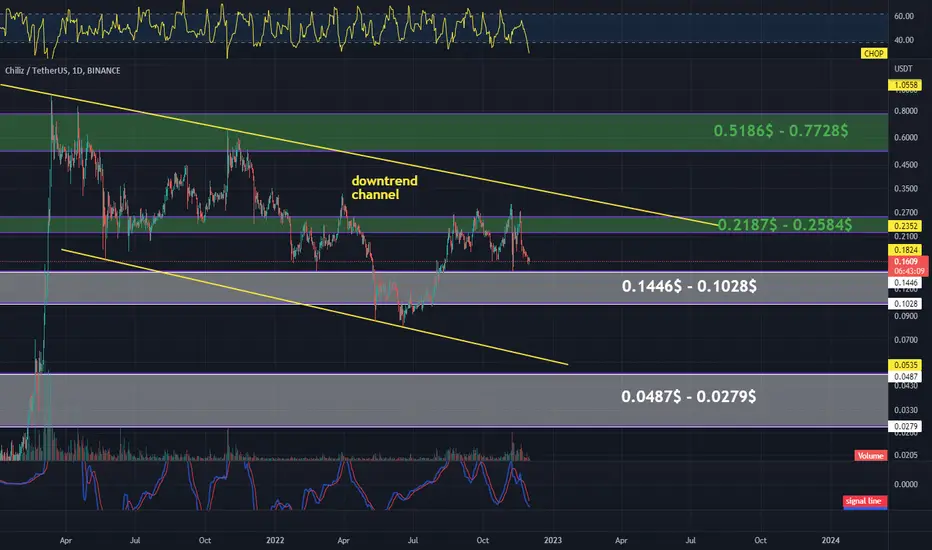
Hello everyone, let's look at the CHZ to USDT 1 day chart. As you can see, the price has been moving in the downtrend channel for a long time.
As we can see, we have marked two support zones, the first short-term zone is from $0.1446 to $0.1028, while if the price goes lower, we can see a drop to the second zone from $0.0487 to $0.0279.
However, if the market changes its trend to an upward first zone of resistance, we have from $ 0.2187 to $ 0.2584 only when the price goes up from it, we can see greater increases around the second zone from $ 0.5186 to $ 0.7728.
Looking at the CHOP indicator, we see that on a 1-day interval, the energy on the CHOP index has been exhausted, and the MACD indicator indicates a downtrend.
Disclaimer
The information and publications are not meant to be, and do not constitute, financial, investment, trading, or other types of advice or recommendations supplied or endorsed by TradingView. Read more in the Terms of Use.
Disclaimer
The information and publications are not meant to be, and do not constitute, financial, investment, trading, or other types of advice or recommendations supplied or endorsed by TradingView. Read more in the Terms of Use.