My trading plan is very simple.
I buy or sell when at least two of these events happen:
* Price tags the top or bottom of parallel channel zones
* Money flow spikes beyond it's Bollinger Bands
* Price at Fibonacci levels
So...
Here's why I'm picking this symbol to do the thing.
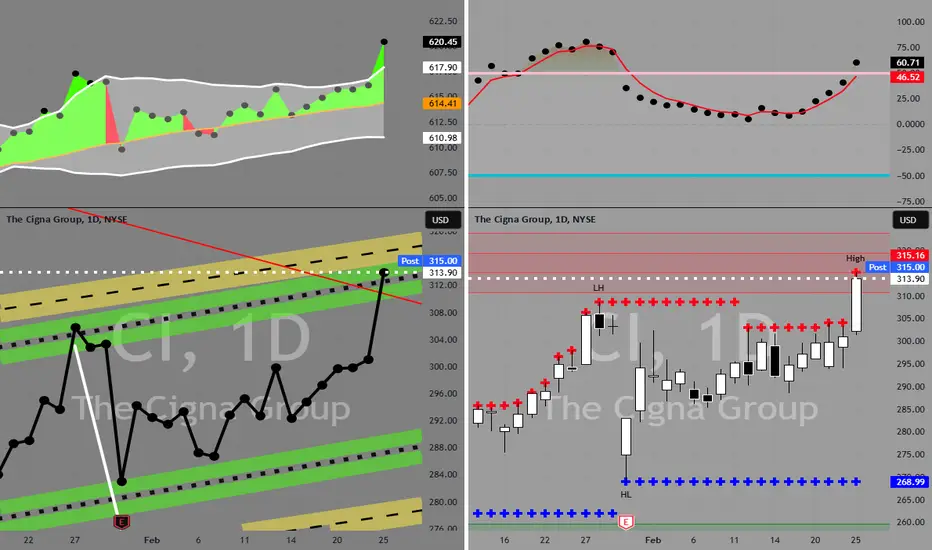
Price in selling zone at top of channels
[Red Line 100 period / Yellow Zone 52 period / Green Zone 26 period]
Stochastic Momentum Index (SMI) at overbought level
Money flow momentum is spiked positive negative and over top of Bollinger Band
Target is lower channel around $288
I buy or sell when at least two of these events happen:
* Price tags the top or bottom of parallel channel zones
* Money flow spikes beyond it's Bollinger Bands
* Price at Fibonacci levels
So...
Here's why I'm picking this symbol to do the thing.
Price in selling zone at top of channels
[Red Line 100 period / Yellow Zone 52 period / Green Zone 26 period]
Stochastic Momentum Index (SMI) at overbought level
Money flow momentum is spiked positive negative and over top of Bollinger Band
Target is lower channel around $288
Trade closed manually
Closed position on 3/12. Disclaimer
The information and publications are not meant to be, and do not constitute, financial, investment, trading, or other types of advice or recommendations supplied or endorsed by TradingView. Read more in the Terms of Use.
Disclaimer
The information and publications are not meant to be, and do not constitute, financial, investment, trading, or other types of advice or recommendations supplied or endorsed by TradingView. Read more in the Terms of Use.