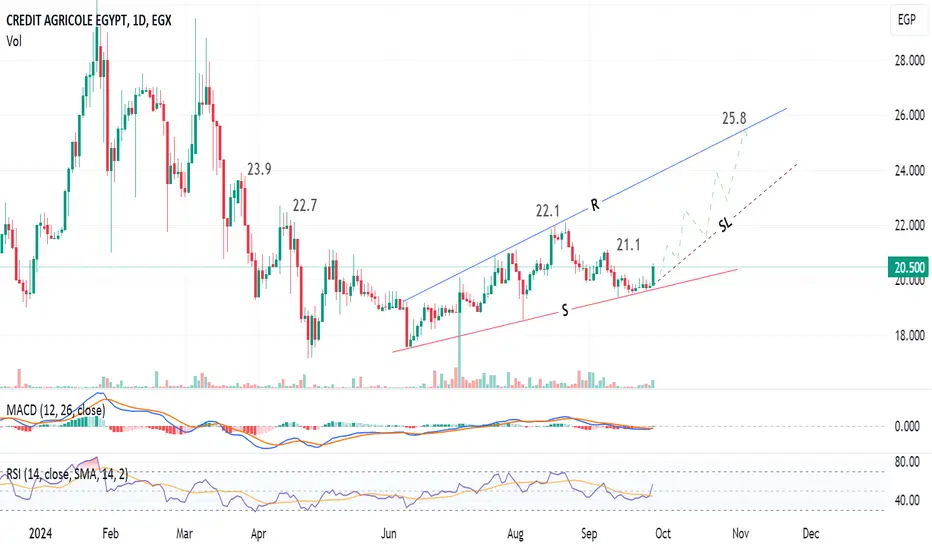
Daily chart, the stock  CIEB is trading in a rising pattern (expanding triangle), and I am expecting the price will go upwards to hit the resistance line R at around 25.8 passing through the shown resistance levels.
The technical indicators RSI and MACD are signalling a soon bullish rally.
The Stop Loss line SL should be monitored
The technical indicators RSI and MACD are signalling a soon bullish rally.
The Stop Loss line SL should be monitored
Disclaimer
The information and publications are not meant to be, and do not constitute, financial, investment, trading, or other types of advice or recommendations supplied or endorsed by TradingView. Read more in the Terms of Use.
Disclaimer
The information and publications are not meant to be, and do not constitute, financial, investment, trading, or other types of advice or recommendations supplied or endorsed by TradingView. Read more in the Terms of Use.