Long
CJJD Bulish
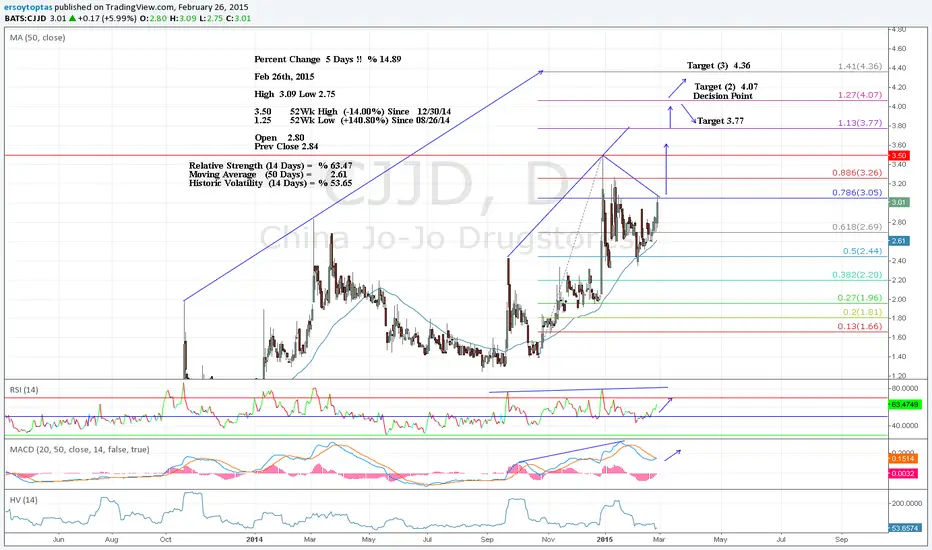
Percent Change 5 days % 14.89
Relative Strength (14 Days) = % 63.47
Moving Average (50 Days) = 2.61
Historic Volatility (14 Days) = % 53.65
Feb 26th, 2015
High 3.09 Low 2.75
3.50 52Wk High (-14.00%) Since 12/30/14
1.25 52Wk Low (+140.80%) Since 08/26/14
Open 2.80
Prev Close 2.84
Relative Strength (14 Days) = % 63.47
Moving Average (50 Days) = 2.61
Historic Volatility (14 Days) = % 53.65
Feb 26th, 2015
High 3.09 Low 2.75
3.50 52Wk High (-14.00%) Since 12/30/14
1.25 52Wk Low (+140.80%) Since 08/26/14
Open 2.80
Prev Close 2.84
Disclaimer
The information and publications are not meant to be, and do not constitute, financial, investment, trading, or other types of advice or recommendations supplied or endorsed by TradingView. Read more in the Terms of Use.
Disclaimer
The information and publications are not meant to be, and do not constitute, financial, investment, trading, or other types of advice or recommendations supplied or endorsed by TradingView. Read more in the Terms of Use.