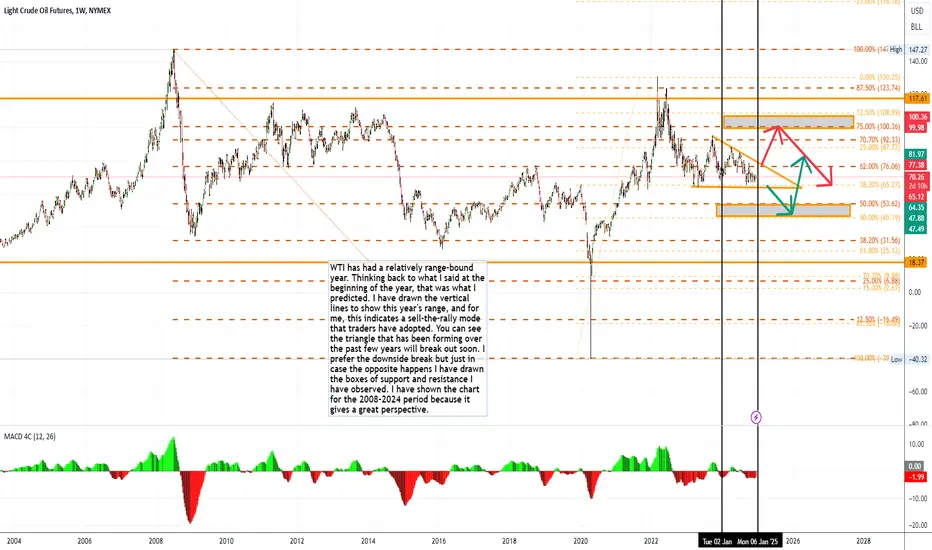
WTI has had a relatively range-bound year. Thinking back to what I said at the beginning of the year, that was what I predicted. I have drawn the vertical lines to show this year's range, and for me, this indicates a sell-the-rally mode that traders have adopted. You can see the triangle that has been forming over the past few years will break out soon. I prefer the downside break but just in case the opposite happens I have drawn the boxes of support and resistance I have observed. I have shown the chart for the 2008-2024 period because it gives a great perspective.
Mark Langley
Disclaimer
The information and publications are not meant to be, and do not constitute, financial, investment, trading, or other types of advice or recommendations supplied or endorsed by TradingView. Read more in the Terms of Use.
Mark Langley
Disclaimer
The information and publications are not meant to be, and do not constitute, financial, investment, trading, or other types of advice or recommendations supplied or endorsed by TradingView. Read more in the Terms of Use.