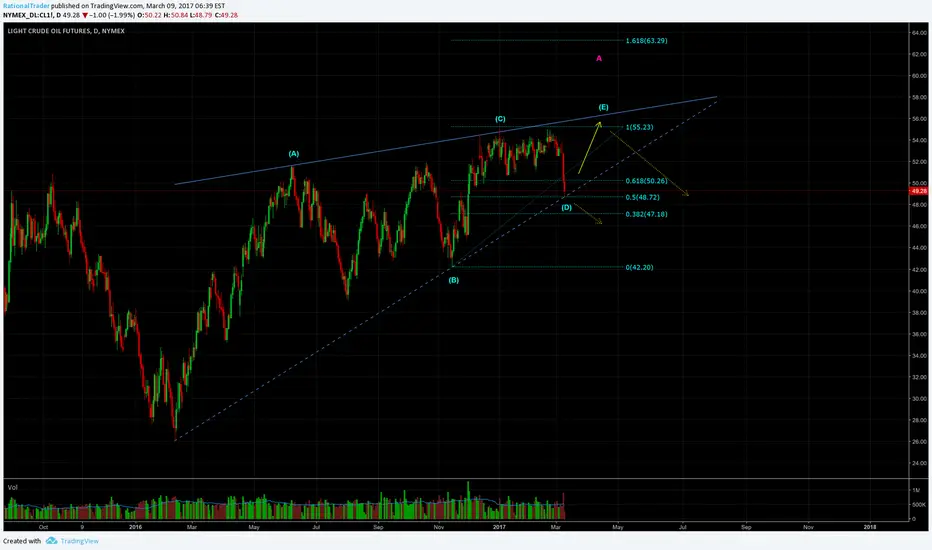
This wave count suggest one more leg up to form an intermediate wave E before a larger price drop. In a primarily wave count (dark pink) I am open for the possibility the blue wedge being a wave A in a ABC correction.
Stay aware that price might as well break out at point (D) as we are moving pretty close to the wedge's apex now. If point D is broken I suggest closing any longs. Watch how price currently behaves around dotted blue trendline near point (D) on lower timeframe for clues of a potential breakout.
Stay aware that price might as well break out at point (D) as we are moving pretty close to the wedge's apex now. If point D is broken I suggest closing any longs. Watch how price currently behaves around dotted blue trendline near point (D) on lower timeframe for clues of a potential breakout.
Note
Two structures to watch. In addition to the wedge above we have a unorthodox ascending triangle as well that is pushing force on price from below. As long as we get higher lows as we just have seemed to got in point D now.
Disclaimer
The information and publications are not meant to be, and do not constitute, financial, investment, trading, or other types of advice or recommendations supplied or endorsed by TradingView. Read more in the Terms of Use.
Disclaimer
The information and publications are not meant to be, and do not constitute, financial, investment, trading, or other types of advice or recommendations supplied or endorsed by TradingView. Read more in the Terms of Use.