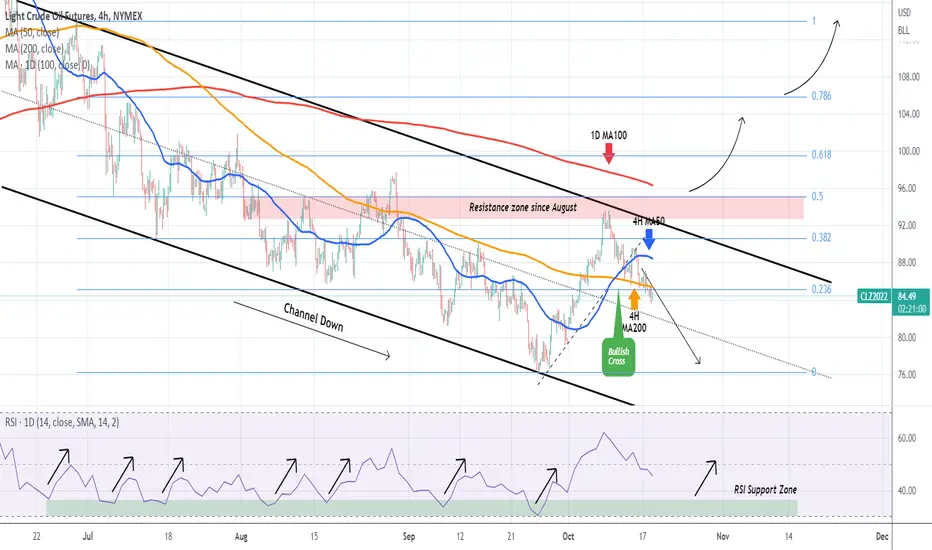
This is an update to our WTI Oil (USOIL) post published last week, as our sell signal was confirmed:
The price broke below both the (dashed) Higher Lows trend-line and the 4H MA200 (orange trend-line) and following the Rejection on the August Resistance Zone and the pricing of the new Lower High on the Channel Down since June, we can now expect at least a test of the previous Low at 76.30. A break above the 4H MA50 (blue trend-line) shouldn't invalidate that.
In our opinion technically only a 1D candle closing above the August Resistance Zone will be a bullish break-out signal (aimed at the 0.786 Fib), which now will be a break above both the 1D MA100 (red trend-line) and the 0.5 Fibonacci retracement level. We can start considering booking the sell and instead open a lower buy position when the 4H RSI breaks into its multi-month Support Zone. As you see, such RSI rebounds have always hit the 4H MA50 at least.
-------------------------------------------------------------------------------
** Please LIKE 👍, SUBSCRIBE ✅, SHARE 🙌 and COMMENT ✍ if you enjoy this idea! Also share your ideas and charts in the comments section below! This is best way to keep it relevant, support me, keep the content here free and allow the idea to reach as many people as possible. **
-------------------------------------------------------------------------------
You may also TELL ME 🙋♀️🙋♂️ in the comments section which symbol you want me to analyze next and on which time-frame. The one with the most posts will be published tomorrow! 👏🎁
-------------------------------------------------------------------------------
👇 👇 👇 👇 👇 👇
💸💸💸💸💸💸
👇 👇 👇 👇 👇 👇
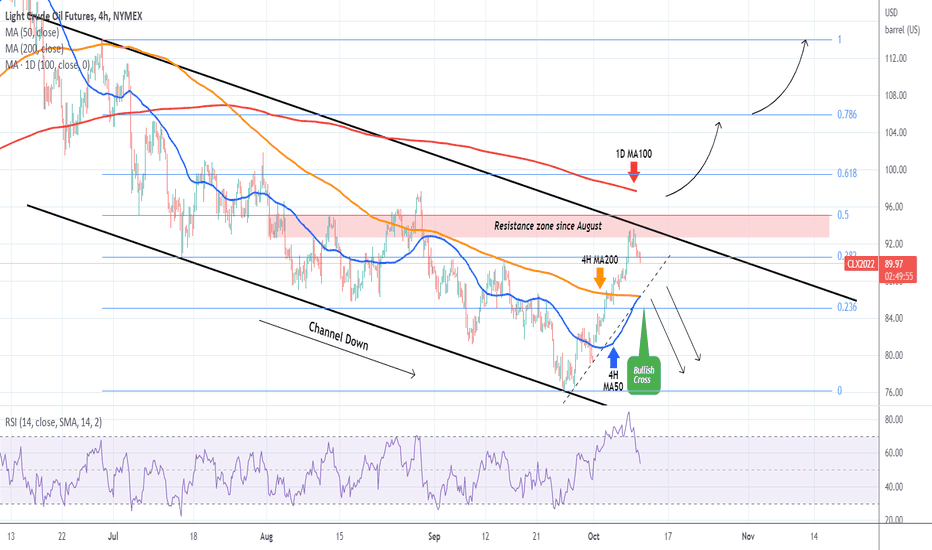
👑Best Signals (Forex/Crypto+70% accuracy) & Account Management (+20% profit/month on 10k accounts)
💰Free Channel t.me/tradingshotglobal
🤵Contact info@tradingshot.com t.me/tradingshot
🔥New service: next X100 crypto GEMS!
💰Free Channel t.me/tradingshotglobal
🤵Contact info@tradingshot.com t.me/tradingshot
🔥New service: next X100 crypto GEMS!
Disclaimer
The information and publications are not meant to be, and do not constitute, financial, investment, trading, or other types of advice or recommendations supplied or endorsed by TradingView. Read more in the Terms of Use.