WTI Crude Oil Trading Analysis: June-August 2025 Review & Week of August 25th Recommendations
Analysis Date: August 23, 2025
Market: WTI Crude Oil Futures (CL1!)
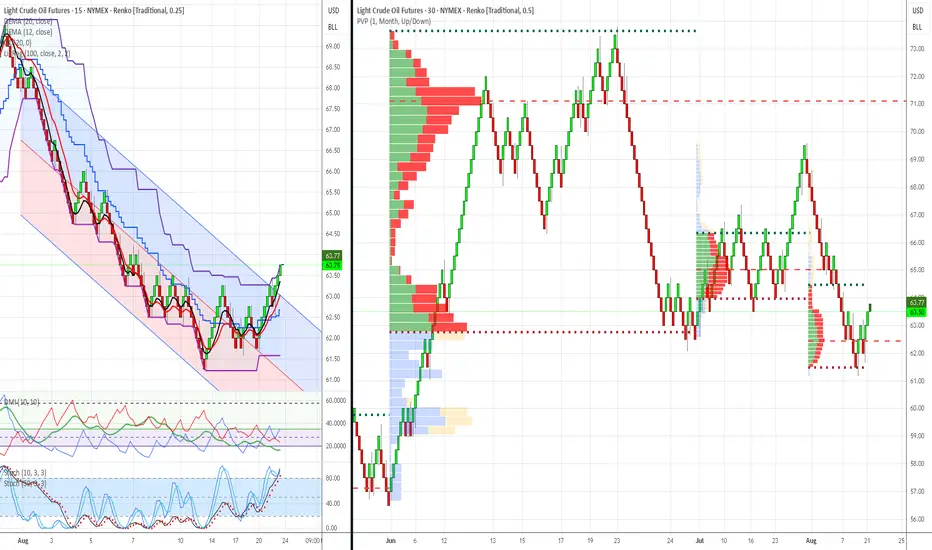
Methodology: Dual Renko Chart System ($0.25/15min + $0.50/30min)
Volume Profile: 3-Month Monthly Analysis (June-August 2025)
Executive Summary
3-Month Market Structure Analysis (June-August 2025)
Phase 1: Distribution & Breakdown (June-July)
Price Action: $72 → $61 (-15% decline)
Phase 2: Accumulation & Reversal Setup (Late July-August)
Price Action: $61 → $63.50 (+4% recovery)
Volume Profile Key Levels (3-Month Analysis)
Major Support Zones:
Resistance Zones:
Current Technical Analysis (August 23, 2025)
Dual Chart Assessment
$0.50 Chart (Structure Analysis):
$0.25 Chart (Execution Analysis):
Technical Confluences Supporting Bull Case
Market Context & Macro Considerations
Current Oil Market Dynamics
Federal Reserve Impact
Seasonal Factors
Conclusion & Strategic Outlook
Near-Term Assessment (1-2 weeks): The current setup represents a high-probability swing trading opportunity with exceptional risk/reward characteristics. The combination of institutional volume support, technical reversal signals, and favorable market structure creates optimal conditions for bullish positioning.
Medium-Term Outlook (1-3 months): Successful navigation through the $66-68 resistance zone could establish a broader recovery toward $70-72 levels. However, macroeconomic headwinds and seasonal factors require careful position management and profit-taking discipline.
Risk Assessment: While the setup is compelling, traders must respect the institutional accumulation levels as ultimate support. Any violation of the $62 zone would invalidate the bullish thesis and require immediate position liquidation.
Strategic Advantage: The dual Renko chart system provides both structural clarity and tactical precision, enabling confident position sizing and systematic risk management. The monthly volume profile offers institutional-level insight typically unavailable to retail traders.
Document Classification: Trading Analysis & Recommendations
Risk Disclaimer: Past performance does not guarantee future results. All trading involves risk of loss.
Analysis Date: August 23, 2025
Market: WTI Crude Oil Futures (CL1!)
Methodology: Dual Renko Chart System ($0.25/15min + $0.50/30min)
Volume Profile: 3-Month Monthly Analysis (June-August 2025)
Executive Summary
Market Regime: Oil has completed a major corrective phase from $72 highs to $61 lows, establishing a clear bottoming pattern with strong institutional accumulation. Current setup presents high-probability bullish swing opportunity with excellent risk/reward characteristics.
Current Status: Bullish reversal confirmed with multiple technical confluences at critical support zone. Recommended positioning for upside targets with systematic risk management protocols.
3-Month Market Structure Analysis (June-August 2025)
Phase 1: Distribution & Breakdown (June-July)
Price Action: $72 → $61 (-15% decline)
- June Peak: Heavy red volume distribution at $71-72 level indicated institutional selling
- July Decline: Clean Renko downtrend with sustained selling pressure
- Volume Profile: Minimal volume during decline, suggesting limited buying interest until $63-64 zone
Phase 2: Accumulation & Reversal Setup (Late July-August)
Price Action: $61 → $63.50 (+4% recovery)
- Institutional Buying: Massive green volume accumulation at $63-65 level
- Support Establishment: $62-63 zone showing strong buying interest
- Technical Reversal: DEMA crossover confirmed bullish momentum shift
Volume Profile Key Levels (3-Month Analysis)
Major Support Zones:
- $62-63: Primary institutional accumulation (heaviest green volume)
- $60-61: Secondary support with moderate green volume
- $58-59: Ultimate support level (limited historical volume)
Resistance Zones:
- $66-67: First institutional resistance (mixed volume)
- $69-70: Major distribution zone (heavy red volume from June)
- $71-72: Ultimate resistance (peak selling pressure)
Current Technical Analysis (August 23, 2025)
Dual Chart Assessment
$0.50 Chart (Structure Analysis):
- Trend: Clear bottoming pattern completed at $61 low
- Current Position: Testing above major institutional accumulation zone
- Volume Confirmation: Trading within heaviest 3-month green volume cluster
- Structure: Higher lows pattern emerging since $61 bottom
$0.25 Chart (Execution Analysis):
- DEMA Status: Bullish crossover confirmed (Black above Red at $63.00)
- DMI/ADX: +DI gaining momentum, ADX rising through 25 level
- Donchian Position: Price above basis, testing toward upper band
- Recent Action: 3 consecutive green bricks confirming upward momentum
Technical Confluences Supporting Bull Case
- Volume Profile: Massive institutional support at current levels
- DEMA Crossover: Clear trend reversal signal confirmed
- Momentum: DMI showing bullish shift with strengthening ADX
- Structure: Higher low pattern vs. $61 bottom
- Risk/Reward: Excellent positioning near major support zone
Market Context & Macro Considerations
Current Oil Market Dynamics
- Supply: OPEC+ spare capacity at 5.9 million b/d (bearish)
- Demand: China slowdown offset by US resilience (neutral)
- Inventories: Below 5-year average (bullish)
- Refining: Margins supporting crude demand (bullish)
Federal Reserve Impact
- Policy Stance: Potential September rate cut (bullish for commodities)
- Dollar Weakness: Could support oil prices
- Inflation Expectations: Rising energy costs could influence policy
Seasonal Factors
- Driving Season: Peak summer demand ending (bearish)
- Hurricane Season: Atlantic activity potential (bullish)
- Refinery Maintenance: September turnaround season (mixed)
Conclusion & Strategic Outlook
Near-Term Assessment (1-2 weeks): The current setup represents a high-probability swing trading opportunity with exceptional risk/reward characteristics. The combination of institutional volume support, technical reversal signals, and favorable market structure creates optimal conditions for bullish positioning.
Medium-Term Outlook (1-3 months): Successful navigation through the $66-68 resistance zone could establish a broader recovery toward $70-72 levels. However, macroeconomic headwinds and seasonal factors require careful position management and profit-taking discipline.
Risk Assessment: While the setup is compelling, traders must respect the institutional accumulation levels as ultimate support. Any violation of the $62 zone would invalidate the bullish thesis and require immediate position liquidation.
Strategic Advantage: The dual Renko chart system provides both structural clarity and tactical precision, enabling confident position sizing and systematic risk management. The monthly volume profile offers institutional-level insight typically unavailable to retail traders.
Document Classification: Trading Analysis & Recommendations
Risk Disclaimer: Past performance does not guarantee future results. All trading involves risk of loss.
Disclaimer
The information and publications are not meant to be, and do not constitute, financial, investment, trading, or other types of advice or recommendations supplied or endorsed by TradingView. Read more in the Terms of Use.
Disclaimer
The information and publications are not meant to be, and do not constitute, financial, investment, trading, or other types of advice or recommendations supplied or endorsed by TradingView. Read more in the Terms of Use.