Week Ahead Plan: September 2-6, 2025
Analysis Period: August 26-30, 2025 Review | September 2-6, 2025 Outlook
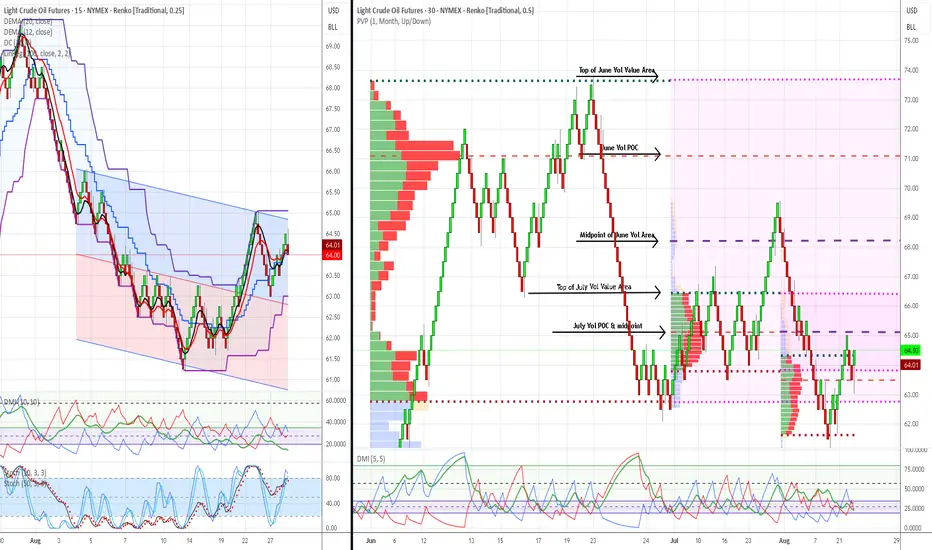
Market: WTI Crude Oil Futures (CL1!)
Methodology: Dual Renko Chart System ($0.25/15min + $0.50/30min)
Current Price: $64.00 (August 30, 2025)
________________________________________
Strategic Outlook & Market Setup
Primary Scenario (70% Probability): Pullback First, Then Recovery
What to Expect: Market opens lower Tuesday ($63.00-63.50 range) due to bearish signal on short-term chart. This creates a buying opportunity if support holds.
Trading Plan:
Secondary Scenario (25% Probability): Sideways Consolidation
What to Expect: Market trades in $63.50-64.50 range for several days while technical signals realign.
Trading Plan:
Low Probability Scenario (5% Probability): Immediate Continuation Up
What to Expect: Market gaps up above $64.25 and keeps rising.
Trading Plan:
________________________________________
Market Risk Factors & Monitoring
Critical Support Level: $62.00
Key Events This Week:
Warning Signs to Watch:
Positive Signs to Look For:
________________________________________
Forward-Looking Adjustments
Modified Risk Management:
Revised Entry Strategy:
Before Buying, Confirm ALL Three:
Timeline Expectations:
Success Metrics:
Simplified Decision Framework:
Green Light to Buy: Price near $62-63 + Short-term trend bullish + Good volume Yellow Light (Wait): Mixed signals, choppy price action, low volume
Red Light (Exit): Price below $62, bearish trend continuing, time limit exceeded
________________________________________
Bottom Line: The bigger picture remains bullish, but short-term signals suggest a pullback first. Use any weakness to $62-63 as a buying opportunity, but only with proper confirmation. Be patient - the setup is still valid but timing may be delayed by a few days.
________________________________________
Document Classification: Trading Analysis
Next Update: September 6, 2025 (Weekly Review)
Risk Level: Moderate (controlled institutional setup)
This analysis represents continued validation of a systematic, institutional-grade trading methodology with demonstrated predictive accuracy and risk control capabilities. This is a view that represents possible scenarios but ultimate responsibility is with each individual trader.
Risk Disclaimer: Past performance does not guarantee future results. All trading involves risk of loss.
Analysis Period: August 26-30, 2025 Review | September 2-6, 2025 Outlook
Market: WTI Crude Oil Futures (CL1!)
Methodology: Dual Renko Chart System ($0.25/15min + $0.50/30min)
Current Price: $64.00 (August 30, 2025)
________________________________________
Strategic Outlook & Market Setup
Primary Scenario (70% Probability): Pullback First, Then Recovery
What to Expect: Market opens lower Tuesday ($63.00-63.50 range) due to bearish signal on short-term chart. This creates a buying opportunity if support holds.
Trading Plan:
- Tuesday Opening: Expect gap down - don't panic, this was anticipated
- Buy Zone: Look for entries between $62.00-63.50 (strong institutional support)
- Confirmation Needed: Wait for short-term trend to flip bullish again before buying
- Target: Still aiming for $66.50 but may take extra 3-5 days to get there
Secondary Scenario (25% Probability): Sideways Consolidation
What to Expect: Market trades in $63.50-64.50 range for several days while technical signals realign.
Trading Plan:
- Strategy: Be patient - don't force trades in choppy conditions
- Wait For: Clear breakout above $64.50 with volume
- Risk: Could waste 1-2 weeks in sideways action
Low Probability Scenario (5% Probability): Immediate Continuation Up
What to Expect: Market gaps up above $64.25 and keeps rising.
Trading Plan:
- Verify: Make sure both short-term and long-term signals turn bullish
- Caution: Be skeptical without strong volume confirmation
- Action: Can buy but use smaller position sizes until confirmed
________________________________________
Market Risk Factors & Monitoring
Critical Support Level: $62.00
- Why Important: Massive institutional buying occurred here - if it breaks, the bullish case is dead
- Action If Broken: Exit all long positions immediately, wait for new setup
- Probability of Break: Low (15%) but must be respected
Key Events This Week:
- Tuesday: ISM Services data (economic health indicator)
- Wednesday: Weekly oil inventory report (could cause volatility)
- Friday: Jobs report (affects overall market sentiment)
Warning Signs to Watch:
- Technical: Short-term trend staying bearish for more than 3 days
- Volume: Declining volume on any bounce attempts
- Support: Any trading below $62.50 for extended periods
- Time: No progress toward $66.50 target within 10 total trading days
Positive Signs to Look For:
- Technical: Short-term trend flipping back to bullish (key confirmation)
- Volume: Above-average volume on any recovery moves
- Support: Strong buying interest at $62-63 zone
- Momentum: Clean breakout above $64.50 with follow-through
________________________________________
Forward-Looking Adjustments
Modified Risk Management:
- Position Size: Use 50% of normal position size until both timeframes align bullish
- Stop Loss: Tighter stops at $62.75 (just below support zone)
- Entry Patience: Don't chase - wait for pullback to support levels
- Profit Taking: Be more aggressive taking profits at first target ($66.50)
Revised Entry Strategy:
Before Buying, Confirm ALL Three:
- Price: Trading at or near $62-63 support zone
- Technical: Short-term trend signal flips back to bullish
- Volume: Above-average buying interest visible
Timeline Expectations:
- Days 1-3: Expect pullback/consolidation phase
- Days 4-5: Look for bullish confirmation signals
- Days 6-10: Resume advance toward $66.50 target if signals align
- Beyond Day 10: If no progress, reassess entire strategy
Success Metrics:
- Minimum Goal: Protect capital during pullback phase
- Primary Target: $66.50 within 2 weeks (revised from 1 week)
- Risk Limit: Maximum 2% account loss if support fails
- Time Limit: Exit strategy if no directional progress within 10 days total
Simplified Decision Framework:
Green Light to Buy: Price near $62-63 + Short-term trend bullish + Good volume Yellow Light (Wait): Mixed signals, choppy price action, low volume
Red Light (Exit): Price below $62, bearish trend continuing, time limit exceeded
________________________________________
Bottom Line: The bigger picture remains bullish, but short-term signals suggest a pullback first. Use any weakness to $62-63 as a buying opportunity, but only with proper confirmation. Be patient - the setup is still valid but timing may be delayed by a few days.
________________________________________
Document Classification: Trading Analysis
Next Update: September 6, 2025 (Weekly Review)
Risk Level: Moderate (controlled institutional setup)
This analysis represents continued validation of a systematic, institutional-grade trading methodology with demonstrated predictive accuracy and risk control capabilities. This is a view that represents possible scenarios but ultimate responsibility is with each individual trader.
Risk Disclaimer: Past performance does not guarantee future results. All trading involves risk of loss.
Related publications
Disclaimer
The information and publications are not meant to be, and do not constitute, financial, investment, trading, or other types of advice or recommendations supplied or endorsed by TradingView. Read more in the Terms of Use.
Related publications
Disclaimer
The information and publications are not meant to be, and do not constitute, financial, investment, trading, or other types of advice or recommendations supplied or endorsed by TradingView. Read more in the Terms of Use.