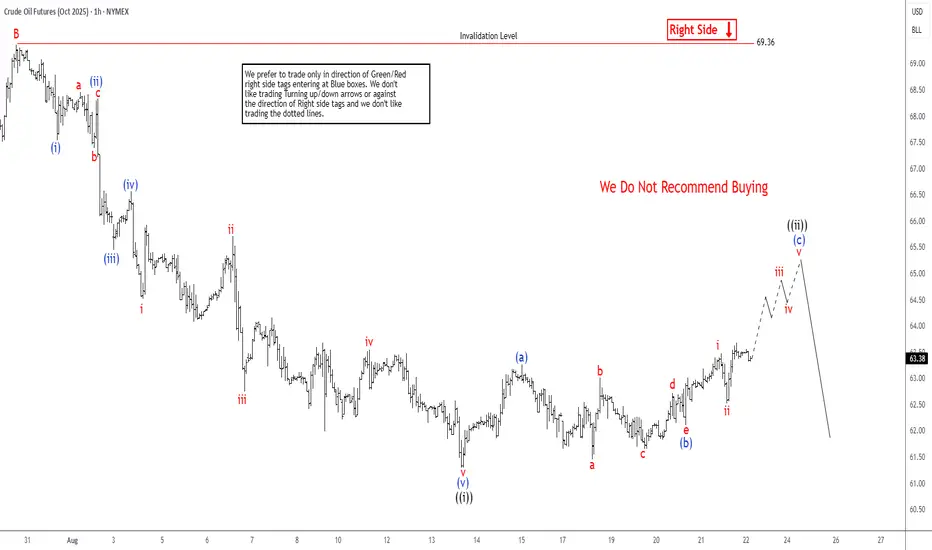
Crude oil (CL) exhibits a bearish trend following its June 23, 2025, peak, signaling further declines. The ongoing descent forms a zigzag Elliott Wave pattern. From the June high, wave A dropped to $64, while wave B rebounded to $70.58, as depicted in the accompanying one-hour chart. Wave C, now unfolding, breaks into a five-wave impulse structure. From wave B’s peak, wave (i) concluded at $68.56, followed by a wave (ii) rally to $69.58. The commodity then fell in wave (iii) to $66.56, with wave (iv) recovering to $67.74.
Currently, oil continues its decline in wave (v), reaching $61.94, completing wave ((i)) in a higher degree. A corrective rally in wave ((ii)) is underway, structured as a lesser-degree zigzag. From wave ((i)), wave (a) climbed to $64.15, followed by a wave (b) pullback forming a triangle, ending at $62.52. Wave (c) is now advancing toward the $64.68–$66.01 range, corresponding to a 100%–161.8% Fibonacci extension of wave (a), to complete wave ((ii)) before resuming the downtrend. In the near term, as long as the $70.58 pivot holds, expect corrective rallies to falter in a 3, 7, or 11-swing pattern, paving the way for further declines.
Currently, oil continues its decline in wave (v), reaching $61.94, completing wave ((i)) in a higher degree. A corrective rally in wave ((ii)) is underway, structured as a lesser-degree zigzag. From wave ((i)), wave (a) climbed to $64.15, followed by a wave (b) pullback forming a triangle, ending at $62.52. Wave (c) is now advancing toward the $64.68–$66.01 range, corresponding to a 100%–161.8% Fibonacci extension of wave (a), to complete wave ((ii)) before resuming the downtrend. In the near term, as long as the $70.58 pivot holds, expect corrective rallies to falter in a 3, 7, or 11-swing pattern, paving the way for further declines.
14 days trial --> elliottwave-forecast.com/plan-trial/ and get Accurate & timely Elliott Wave Forecasts of 78 instruments. Webinars, Chat Room, Stocks/Forex/Indices Signals & more.
Disclaimer
The information and publications are not meant to be, and do not constitute, financial, investment, trading, or other types of advice or recommendations supplied or endorsed by TradingView. Read more in the Terms of Use.