🔎 Technical Picture
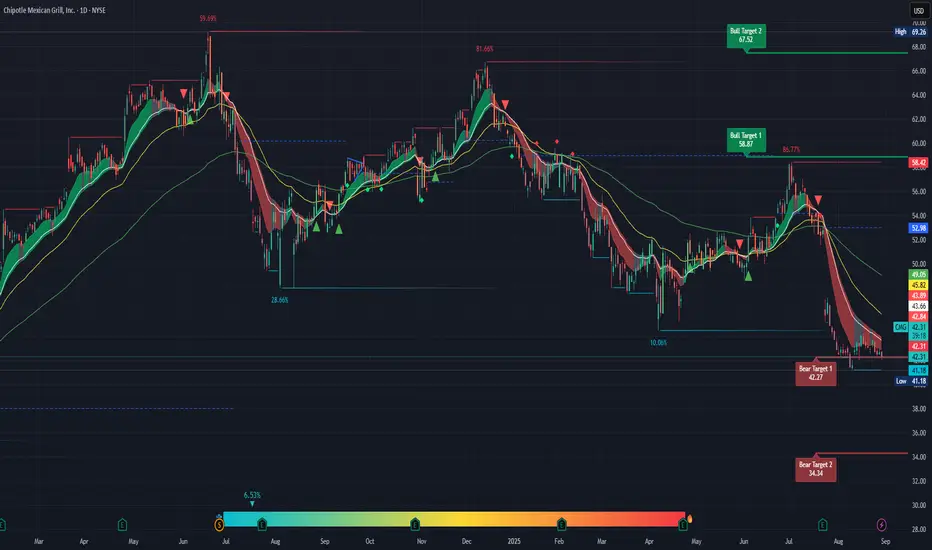
• Trend: Still in a downtrend. Price is trading below the 10, 20, 50, and 200 SMAs (42.77, 43.12, 45.29, 50.11). That’s textbook bearish until proven otherwise.
• Support: Current local low at $41.18. If that breaks, Bear Target 1 at $38.86 and Bear Target 2 at $34.24 are realistic.
• Resistance: Needs to reclaim $42.77–43.12 zone (cluster of 10 & 20 SMAs). Then $47.22 (Bull Target 1). True reversal signal would require reclaiming the 50-day SMA (45.29) and ideally the 200-day SMA (50.11).
• Momentum: Price Heat Meter is in the lower end, but no strong bullish divergence yet. Bearish continuation is still favored.
________________________________________
⚖️ Cost vs. Benefit
• Buying now: You’re catching a falling knife. Limited upside until price clears resistance. You risk a drop to the 30s if momentum accelerates.
• Waiting: Higher probability entry would be above $43–45 with confirmation. Yes, you’ll miss a few points, but you’ll avoid dead money or a steep drawdown.
• Short/Bearish play: More favorable risk/reward until bulls prove control.
________________________________________
🚩 Too Good to Be True Filter
• Some traders may argue “it’s oversold, time for a bounce.” But oversold does not equal reversal. Without a break of trend structure and volume confirmation, bounces are more likely dead cat rallies than sustainable reversals.
________________________________________
✅ Verdict
• Not a good buy yet.
• No confirmed reversal. You’d be gambling on a bottom.
• Best strategy:
o Aggressive trader: Short/bear bias until $41.18 breaks or $43+ reclaims.
o Swing investor: Wait for a daily close above $45 before considering long positions.
Disclaimer
The information and publications are not meant to be, and do not constitute, financial, investment, trading, or other types of advice or recommendations supplied or endorsed by TradingView. Read more in the Terms of Use.
Disclaimer
The information and publications are not meant to be, and do not constitute, financial, investment, trading, or other types of advice or recommendations supplied or endorsed by TradingView. Read more in the Terms of Use.