📈
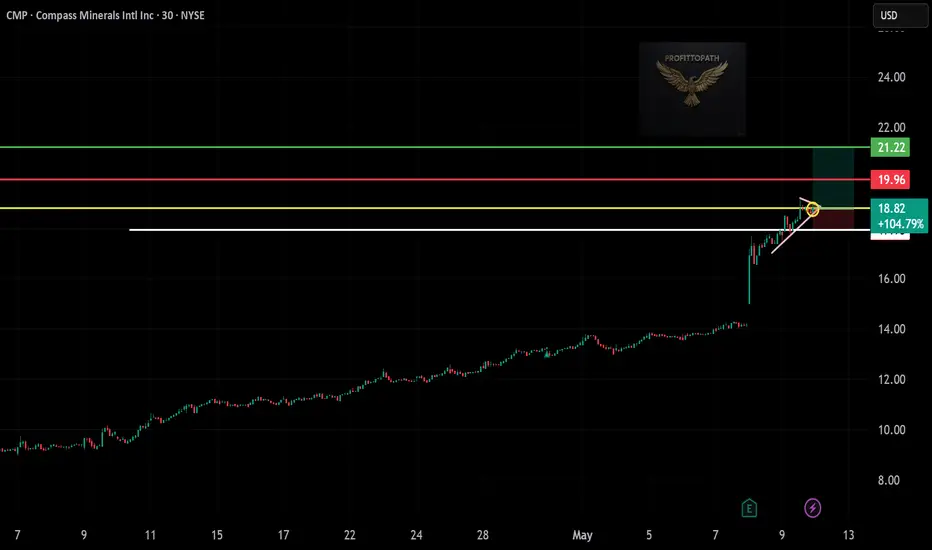
🔹 Asset: Compass Minerals Intl Inc. (NYSE: CMP)
🔹 Timeframe: 30-Minute Chart
🔹 Setup Type: Bullish Pennant Breakout (Trend Continuation)
📌 Trade Plan (Long Position)
✅ Entry Zone: Around $18.82 (Confirmed breakout level)
✅ Stop-Loss (SL): Below $17.95 (Support and breakout invalidation)
🎯 Take Profit Targets
📌 TP1: $19.96 – Recent resistance level
📌 TP2: $21.22 – Measured move target / extension zone
📊 Risk-Reward Calculation
📉 Risk: $18.82 - $17.95 = $0.87
📈 Reward to TP1: $19.96 - $18.82 = $1.14 → R/R = 1:1.31
📈 Reward to TP2: $21.22 - $18.82 = $2.40 → R/R = 1:2.76 ✅
🔍 Technical Highlights
📌 Strong prior breakout followed by bullish consolidation
📌 Pennant formed with healthy volume contraction
📌 Price pushing above resistance with momentum
📌 Higher lows + trendline intact = bullish structure
📈 Execution Strategy
📊 Enter near $18.82 on confirmed breakout candle
📉 SL just below $17.95 to limit downside risk
💰 TP1 at $19.96, trail remainder to $21.22 if momentum holds
🚨 Invalidation Risk
❌ Drop below $17.95 breaks structure
❌ Avoid if breakout lacks volume and follow-through
🚀 Final Take
✔ Strong trend continuation pattern
✔ High probability with defined risk
✔ Excellent R:R if breakout sustains — let winners run!
Disclaimer
The information and publications are not meant to be, and do not constitute, financial, investment, trading, or other types of advice or recommendations supplied or endorsed by TradingView. Read more in the Terms of Use.
Disclaimer
The information and publications are not meant to be, and do not constitute, financial, investment, trading, or other types of advice or recommendations supplied or endorsed by TradingView. Read more in the Terms of Use.