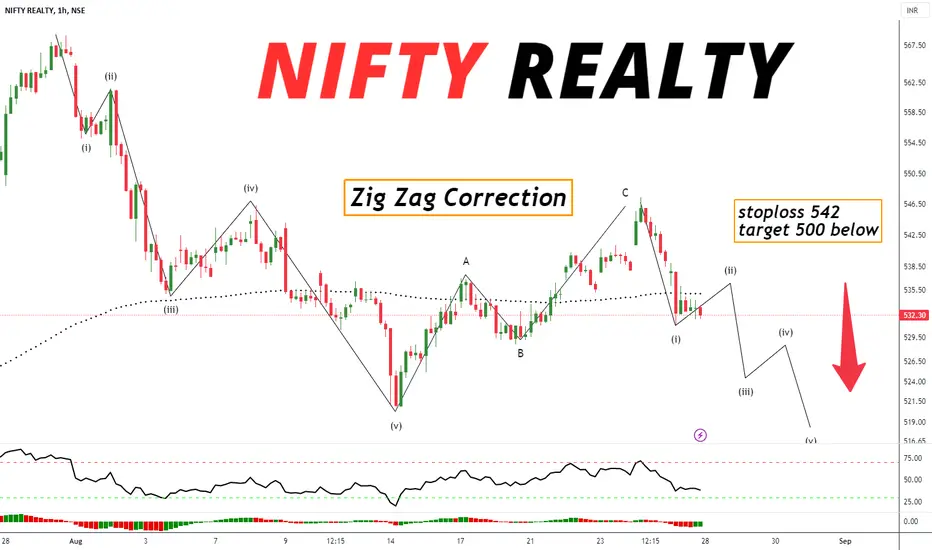
Nifty Realty one hour chart analysis price come down 5 wave .
first down fall 5 wave indicate zig zag correction
Wave A internal wave 1,2,3,4,5 and Wave B internal wave bounce upside Wave A,B,C
and line draw 0-b trendline price cross down side confrim . Wave C start again down side Wave C internal Wave 1,2,3,4,5
first down fall 5 wave indicate zig zag correction
Wave A internal wave 1,2,3,4,5 and Wave B internal wave bounce upside Wave A,B,C
and line draw 0-b trendline price cross down side confrim . Wave C start again down side Wave C internal Wave 1,2,3,4,5
Disclaimer
The information and publications are not meant to be, and do not constitute, financial, investment, trading, or other types of advice or recommendations supplied or endorsed by TradingView. Read more in the Terms of Use.
Disclaimer
The information and publications are not meant to be, and do not constitute, financial, investment, trading, or other types of advice or recommendations supplied or endorsed by TradingView. Read more in the Terms of Use.