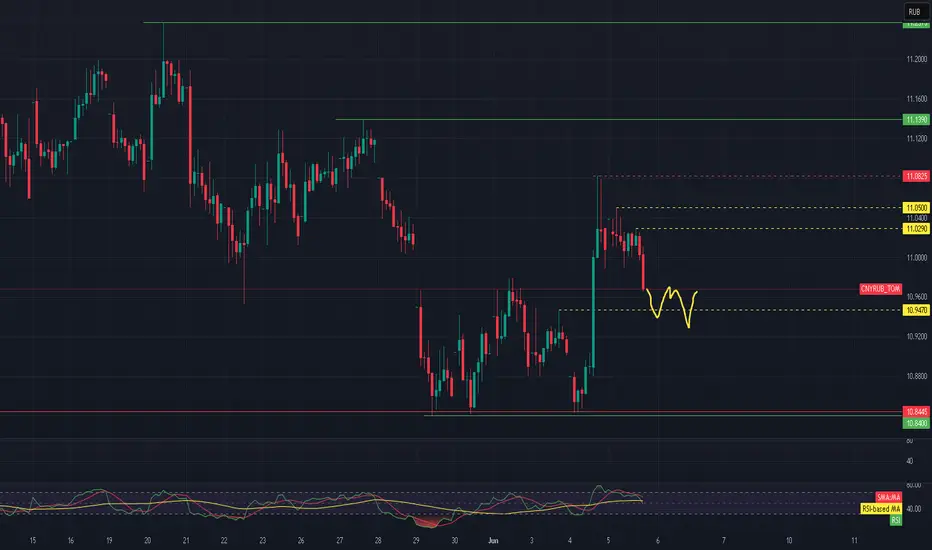
Trading idea:
BUY towards the resistance 11-11.05!
Support & Resistance:
🔴 Resistance Levels:
11.0290 — the nearest key resistance level (local high before the latest drop).
11.0400 – 11.0500 — resistance zone where previous upward moves were halted and reversed.
11.0825 — strong resistance level from which the current downward movement started.
11.1390 — upper boundary of the broader range; a breakout above this could signal a shift in the medium-term trend.
🟡 Support Levels:
10.9470 — local support where price is currently stabilizing and attempting to form a base.
10.8445 – 10.8400 — significant support zone confirmed by multiple touches and sharp bullish reactions in the past.
🔍 Additional Notes:
The price is testing the 10.9470 support and forming a sideways consolidation — a potential base for a bounce.
RSI shows momentum slowing down, but no clear reversal signal yet.
Primary scenario: base formation followed by a potential move back toward 11.0290, provided the support holds.
Disclaimer
The information and publications are not meant to be, and do not constitute, financial, investment, trading, or other types of advice or recommendations supplied or endorsed by TradingView. Read more in the Terms of Use.
Disclaimer
The information and publications are not meant to be, and do not constitute, financial, investment, trading, or other types of advice or recommendations supplied or endorsed by TradingView. Read more in the Terms of Use.
