Coal India has as every other stock had wild momentum and has pretty much reacted in the direction of the market as majority of the stocks have. Like a lot of stocks Coal India has also arrived at its supply zone which has held strong for over a month now. But like every other stock Coal India has a different story to tell according to the technicals. This analysis is purely based on time frame of Daily or Lower.
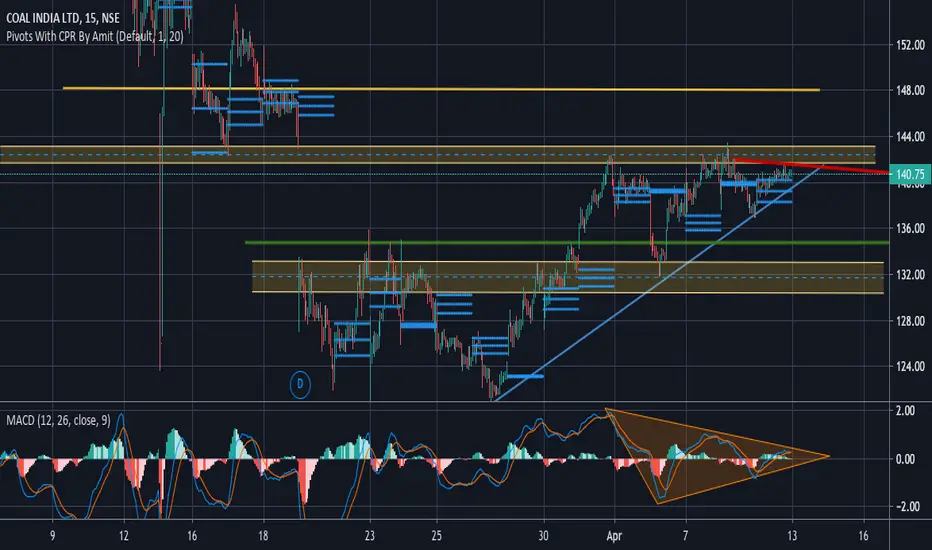
Currently Coal India is testing a supply zone marked in a Yellow channel (where the price currently is). Since the reversal from the downtrend Coal India has been seeing higher lows and consistent highs which has led to a Triangle formation supported by the Yellow Channel on the top and the Blue line as the base. While the price was increasing we can see a squeeze in the CPR and MACD indicating a building momentum.Towards the downside sits a green line acting as a first hand support followed by a yellow channel which is a demand zone which calls for a strong support. On the upside the yellow line should ideally be a traders target which is also a zone of consolidation and testing. The red line will act as a dynamic support if it is broken wherein a trader could look for a possible retracement before a breakout.
The CPR and MACD Squeeze supported by a completed formation and current volatility is indicating towards a building momentum and a possible strong move. A high volume might dictate the side of the trend but what will the market look to favour remains to be seen.
Disclaimer
The information and publications are not meant to be, and do not constitute, financial, investment, trading, or other types of advice or recommendations supplied or endorsed by TradingView. Read more in the Terms of Use.
Disclaimer
The information and publications are not meant to be, and do not constitute, financial, investment, trading, or other types of advice or recommendations supplied or endorsed by TradingView. Read more in the Terms of Use.