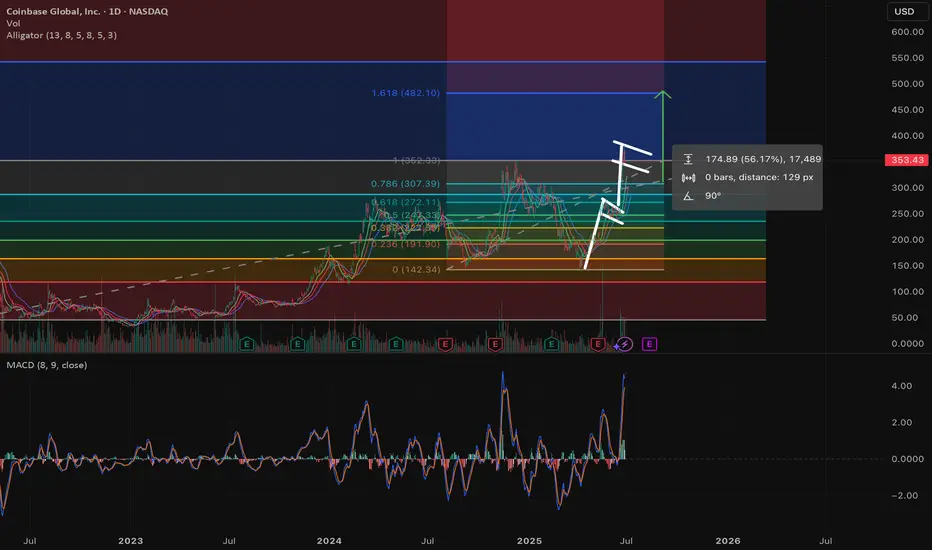
Let's dive into a technical analysis of Coinbase (COIN) stock with your requested indicators and patterns on a daily chart, as of Friday, June 27, 2025, at 9:27:54 PM PDT.
**Current Price & Performance:**
* **Last Price:** $353.297 (as of 4:00 PM ET on June 27, 2025)
* **Today's Change:** Down $15.779999 (-4.27399%)
* **Previous Close:** $369.21
* **Today's Range:** $346.66 - $372.50
* **52-Week Range:** $142.58 - $382.00
COIN has seen a significant run-up recently, up 44% in June, and was added to the S&P 500 in May, which has likely contributed to buying pressure from index funds. Today's session saw a notable pullback.
---
### **Bull Flag Analysis: Played Out & Potentially Forming**
A "bull flag" is a bullish continuation pattern that forms during an uptrend. It consists of:
1. **Flagpole:** A strong, sharp price increase (the "pole").
2. **Flag:** A period of consolidation, often a rectangular or parallelogram shape, with a slight downward or sideways slope, characterized by decreasing volume.
**The Bull Flag that Played Out:**
COIN has been in a strong uptrend in recent weeks and months, particularly in June. This sustained upward movement would have created multiple "flagpoles." As the stock consolidates after these sharp moves before continuing higher, those consolidation phases would represent the "flags."
Given COIN's significant increase of 44% in June and reaching near its 52-week high, it's highly probable that **a series of bull flags have played out** during its ascent. Each time COIN had a strong upward leg, followed by a brief period of sideways or slightly downward consolidation (the flag), it then broke out to the upside, continuing the overall bullish trend. This pattern aligns with its recent performance.
**Another One Potentially Forming:**
Today's 4.27% drop, coming after COIN hit multi-month highs, could be the *start* of a new "flag" formation.
* **New Flagpole:** The sharp run-up through June to the recent high of $382 can be considered the latest "flagpole."
* **Potential Flag:** The current pullback to $353.297 (and intraday low of $346.66) could be the initial phase of consolidation that forms the "flag." For this to be a classic bull flag, we would expect:
* **Consolidation:** The price to trade within a relatively tight, slightly downward-sloping or sideways channel for a few days or weeks.
* **Decreasing Volume:** Volume to typically decrease during this consolidation phase.
* **Breakout:** A subsequent breakout above the upper trendline of this consolidating channel, ideally on increasing volume, to signal the continuation of the previous uptrend.
**Right now, the pattern is very nascent.** It's too early to confirm a new bull flag, but the recent strong rise followed by a pullback fits the initial characteristics. Traders would be watching for the consolidation and then a clear breakout.
---
### **Williams Alligator Strength (Daily Chart)**
The Williams Alligator indicator uses three smoothed moving averages:
* **Lips (Green Line):** 5-period SMMA, shifted 3 bars forward.
* **Teeth (Red Line):** 8-period SMMA, shifted 5 bars forward.
* **Jaw (Blue Line):** 13-period SMMA, shifted 8 bars forward.
**Interpretation:**
* **Strong Trend ("Eating"):** When the lines are fanning out and ordered (Green > Red > Blue for an uptrend, or Blue > Red > Green for a downtrend), the Alligator is "eating" and the trend is strong.
* **Consolidation ("Sleeping"):** When the lines are intertwined or very close together, the Alligator is "sleeping," indicating a non-trending market.
**COIN's Alligator State:**
Given COIN's powerful rally through June, the Williams Alligator was undoubtedly in an **"eating" phase, with its mouth wide open upwards (Green line above Red, Red above Blue)**. This signifies strong bullish momentum.
Today's significant pullback (-4.27%) likely caused the **Lips (green line) to cross below the Teeth (red line)** or at least move very close to it. This indicates the Alligator is beginning to "sate" itself or move towards a "sleeping" phase.
* **Strength:** While the *overall* trend, as indicated by the wider separation of the Teeth and Jaw, might still be considered bullish on a slightly longer timeframe, the *immediate strength* as signaled by the Lips is weakening. The Alligator is likely no longer as aggressively "eating" upwards as it was.
* **Weakening Momentum:** The crossover of the Lips below the Teeth is a short-term bearish signal, suggesting a loss of immediate upward thrust. If the Red line also crosses below the Blue, it would confirm a more significant shift to a neutral or bearish trend.
---
### **Confluence of Two Fibonacci Retracements from Different Top/Bottoms**
Fibonacci retracement levels are typically drawn between a significant price high and a significant price low (or vice versa) to identify potential support and resistance levels. For confluence, we look for areas where different Fibonacci levels from *different* swings align, creating stronger price zones.
Let's consider two potential significant swings for COIN based on its recent price action and 52-week range:
**1. Recent Major Swing:** From 52-Week Low to Recent High
* **Low:** Approximately $142.58 (52-week low)
* **High:** Approximately $382.00 (recent high)
Applying Fibonacci retracement to this major upward swing:
* **23.6% Retracement:** $(382.00 - 142.58) * 0.236 + 142.58 = \$199.14$
* **38.2% Retracement:** $(382.00 - 142.58) * 0.382 + 142.58 = \$233.15$
* **50.0% Retracement:** $(382.00 - 142.58) * 0.500 + 142.58 = \$259.98$
* **61.8% Retracement:** $(382.00 - 142.58) * 0.618 + 142.58 = \$286.82$
**2. More Recent, Shorter-Term Swing:** From a recent consolidation low to the recent high
Let's consider a recent short-term low before the final push to the recent high. One source points to a swing low of **$294.56$ (June 23) to a high of $382$ (June 26).**
Applying Fibonacci retracement to this shorter-term swing:
* **23.6% Retracement:** $(382.00 - 294.56) * 0.236 + 294.56 = \$315.21$
* **38.2% Retracement:** $(382.00 - 294.56) * 0.382 + 294.56 = \mathbf{\$327.97}$
* **50.0% Retracement:** $(382.00 - 294.56) * 0.500 + 294.56 = \mathbf{\$338.28}$
* **61.8% Retracement:** $(382.00 - 294.56) * 0.618 + 294.56 = \mathbf{\$348.60}$
**Confluence:**
The current price of COIN is $353.297.
Looking at the second, shorter-term Fibonacci retracement, the **61.8% level at $348.60$ is very close to today's intraday low of $346.66$.** This indicates that this specific Fibonacci level acted as a significant support level today.
While there isn't a direct "confluence" where a 38.2% from one swing aligns perfectly with a 50% from another right at the current price, the fact that the **61.8% retracement from the most recent significant upward impulse ($294.56 to $382.00) provided strong support today** is a key observation.
**Significance:**
* **Recent Support:** The price tested and rebounded from the 61.8% retracement level of its most recent significant rally, which is often considered a strong reversal point for a healthy pullback within an uptrend.
* **Confirmation for Potential Flag:** If this level holds, it reinforces the idea that the current pullback is a "flag" in formation rather than a full trend reversal.
---
### **Overall Summary for COIN:**
* **Bull Flag:** COIN has experienced and completed several bull flags during its ascent. The current pullback from the $382 high could be the formation of **another bull flag**. For confirmation, watch for consolidation within a defined range and a subsequent breakout.
* **Williams Alligator:** The Alligator, which was "eating" aggressively during the recent rally, is now likely showing signs of **sating or sleeping** as the Lips (green line) cross below the Teeth (red line) due to today's pullback. This indicates a weakening of immediate bullish momentum and a potential period of consolidation or correction.
* **Fibonacci Confluence:** The price found strong support at the **61.8% Fibonacci retracement level ($348.60) of its most recent significant swing ($294.56 to $382.00).** This is a critical level for bulls to defend if the overall uptrend is to continue.
**Outlook:**
COIN is currently undergoing a healthy pullback after a strong run. The bullish underlying trend remains, supported by its S&P 500 inclusion and analyst optimism. However, the technical indicators suggest a period of consolidation or further retracement is likely. The $348.60 Fibonacci level will be crucial. If it holds, it increases the likelihood of the current pattern being a bull flag for another leg up. A break below it could lead to deeper retracements.
As always, remember that technical analysis provides probabilities, not certainties. Combining this with fundamental analysis and managing risk is crucial for any investment decision.
Disclaimer
The information and publications are not meant to be, and do not constitute, financial, investment, trading, or other types of advice or recommendations supplied or endorsed by TradingView. Read more in the Terms of Use.
Disclaimer
The information and publications are not meant to be, and do not constitute, financial, investment, trading, or other types of advice or recommendations supplied or endorsed by TradingView. Read more in the Terms of Use.