Weekly chart,
The stock COMI has formed a symmetrical triangle chart pattern, and crossed the Resistance line R.
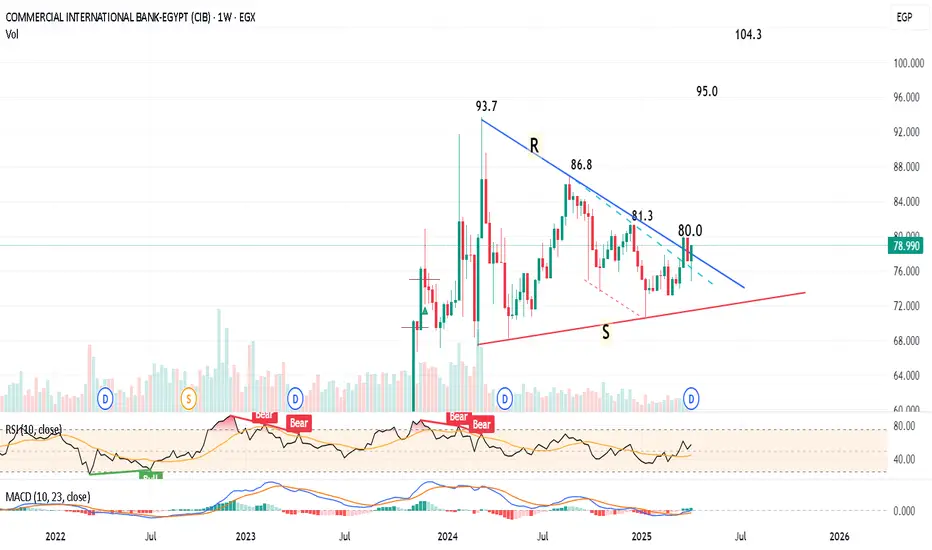
One more week above R, to confirm, the target will be 104.3 - passing through several resistance levels as shown on the chart.
A new entry (buy) can be made immediately before confirmation with higher risk, and consider a stop loss below 76.0
Technical indicators RSI and MACD are positive.
NOTE: Keep a near Profit Protection/ Stop Loss level.
The stock
One more week above R, to confirm, the target will be 104.3 - passing through several resistance levels as shown on the chart.
A new entry (buy) can be made immediately before confirmation with higher risk, and consider a stop loss below 76.0
Technical indicators RSI and MACD are positive.
NOTE: Keep a near Profit Protection/ Stop Loss level.
Disclaimer
The information and publications are not meant to be, and do not constitute, financial, investment, trading, or other types of advice or recommendations supplied or endorsed by TradingView. Read more in the Terms of Use.
Disclaimer
The information and publications are not meant to be, and do not constitute, financial, investment, trading, or other types of advice or recommendations supplied or endorsed by TradingView. Read more in the Terms of Use.