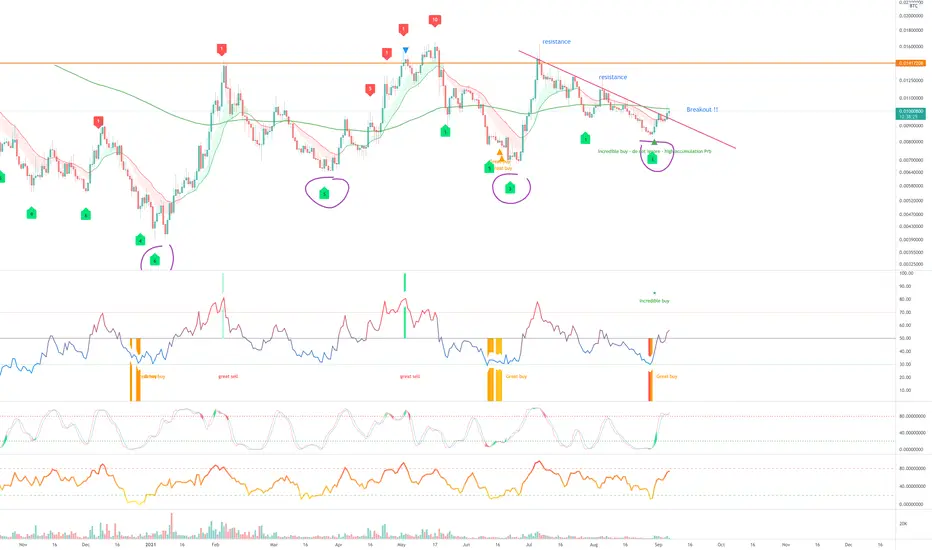
On the above 1-day chart price action has corrected 40% since early July. A number of reasons now exist to be bullish, they include:
1) Price action resistance sees breakout after 63 days (pink line).
2) A ‘incredible buy’ signal was recently printed.
3) Price action made an impulsive move to the upper side of the Bollinger Band (not shown here).
4) Multiple oscillators are diverging with price action (purple circles).
5) The weekly chart (below) is printing an ascending triangle. It has yet to breakout, however I would have no issues going long based on the daily chart alone.
Is it possible price action falls? Sure.
Is it probable? Very unlikely.
1st target is 14k sats
2nd target? That happens after the weekly chart breakout. I’ve no idea.
Good luck!
WW
Weekly chart
Trade active
On the 2-day chart below RSI resistance is broken with back test complete.BTC
bc1q2eckdzh0q8vsd7swcc8et6ze7s99khhxyl7zwy
Weblink: patreon.com/withoutworries
Allow 3-6 months on ideas. Not investment advice. DYOR
bc1q2eckdzh0q8vsd7swcc8et6ze7s99khhxyl7zwy
Weblink: patreon.com/withoutworries
Allow 3-6 months on ideas. Not investment advice. DYOR
Disclaimer
The information and publications are not meant to be, and do not constitute, financial, investment, trading, or other types of advice or recommendations supplied or endorsed by TradingView. Read more in the Terms of Use.
BTC
bc1q2eckdzh0q8vsd7swcc8et6ze7s99khhxyl7zwy
Weblink: patreon.com/withoutworries
Allow 3-6 months on ideas. Not investment advice. DYOR
bc1q2eckdzh0q8vsd7swcc8et6ze7s99khhxyl7zwy
Weblink: patreon.com/withoutworries
Allow 3-6 months on ideas. Not investment advice. DYOR
Disclaimer
The information and publications are not meant to be, and do not constitute, financial, investment, trading, or other types of advice or recommendations supplied or endorsed by TradingView. Read more in the Terms of Use.