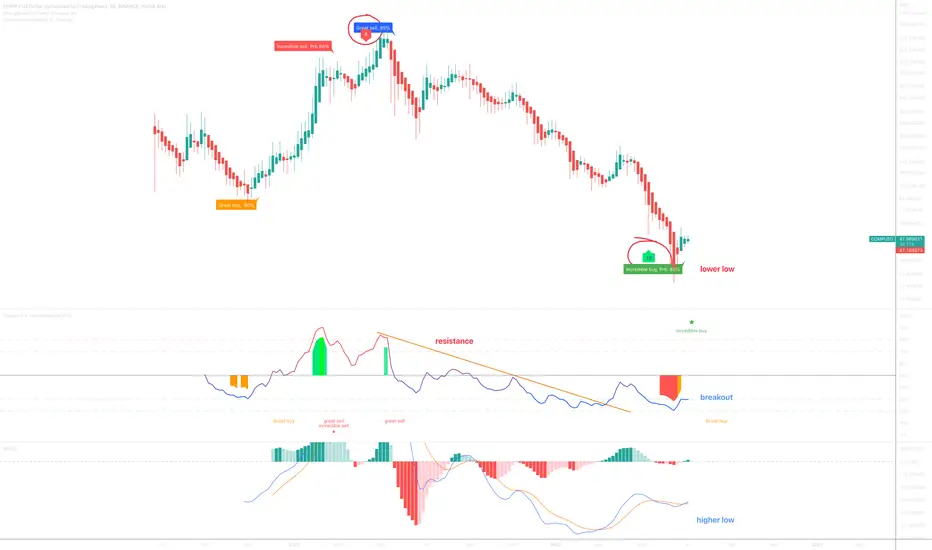
On the above 5-day chart price action has corrected a massive 95% since the double sell signal back in May 2021. Now is an excellent moment to be long. Why?
1) A ‘incredible buy’ signal prints with 85% probability!
2) RSI resistance breakout.
3) Regular bullish divergence. 10 oscillators are currently printing bullish divergence over a 25 day period including MACD.
Is it possible price action falls further? Sure.
Is it probable? No no no. If you want to know what a sure thing looks like, this is as close as you’re going to get.
Good luck.
Ww
Type: trade
Risk: <=6% of portfolio
Timeframe: 2 - 6 months
Targets: 1st $550 By September 2022, 2nd $5500 (Before end of Qrt 1 2023).
BTC
bc1q2eckdzh0q8vsd7swcc8et6ze7s99khhxyl7zwy
Weblink: patreon.com/withoutworries
Allow 3-6 months on ideas. Not investment advice. DYOR
bc1q2eckdzh0q8vsd7swcc8et6ze7s99khhxyl7zwy
Weblink: patreon.com/withoutworries
Allow 3-6 months on ideas. Not investment advice. DYOR
Related publications
Disclaimer
The information and publications are not meant to be, and do not constitute, financial, investment, trading, or other types of advice or recommendations supplied or endorsed by TradingView. Read more in the Terms of Use.