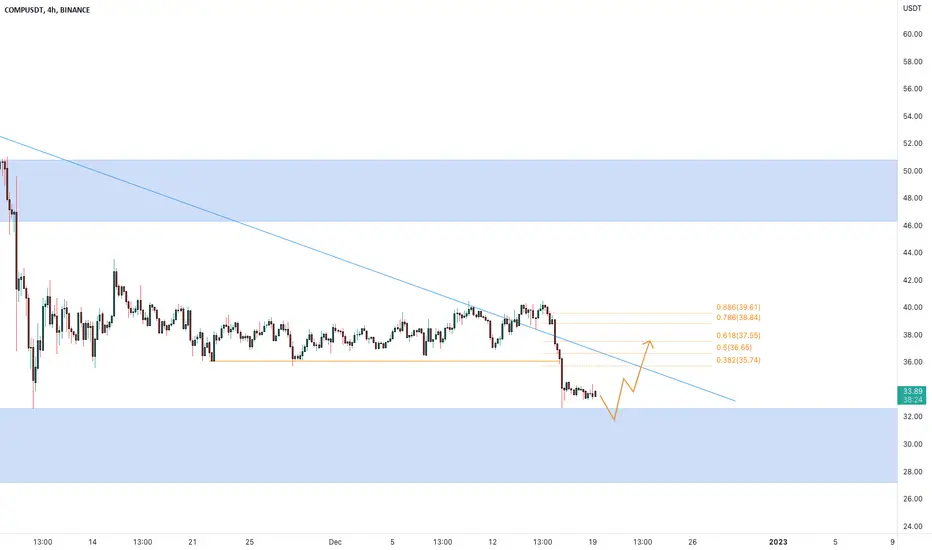
The price is testing the demand zone on the daily timeframe where the market is creating a double bottom.
How to approach it?
IF the price is going to grab new liquidity, we could see a pullback untile 0.5, 0.618 Fibonacci level, so According to Plancton's strategy, we can set a nice order
–––––
Keep in mind.
–––––
Follow the Shrimp 🦐
How to approach it?
IF the price is going to grab new liquidity, we could see a pullback untile 0.5, 0.618 Fibonacci level, so According to Plancton's strategy, we can set a nice order
–––––
Keep in mind.
- 🟣 Purple structure -> Monthly structure.
- 🔴 Red structure -> Weekly structure.
- 🔵 Blue structure -> Daily structure.
- 🟡 Yellow structure -> 4h structure.
- ⚫️ black structure -> <= 1h structure.
–––––
Follow the Shrimp 🦐
Note
the price is following my arrow, let's see if we can see a pullback as I said in my ideaDisclaimer
The information and publications are not meant to be, and do not constitute, financial, investment, trading, or other types of advice or recommendations supplied or endorsed by TradingView. Read more in the Terms of Use.
Disclaimer
The information and publications are not meant to be, and do not constitute, financial, investment, trading, or other types of advice or recommendations supplied or endorsed by TradingView. Read more in the Terms of Use.