Hello?
Hello, traders.
"Like" is a huge force for me.
By "following" you can always get new information quickly.
Thank you for always supporting me.
-------------------------------------------------- -----
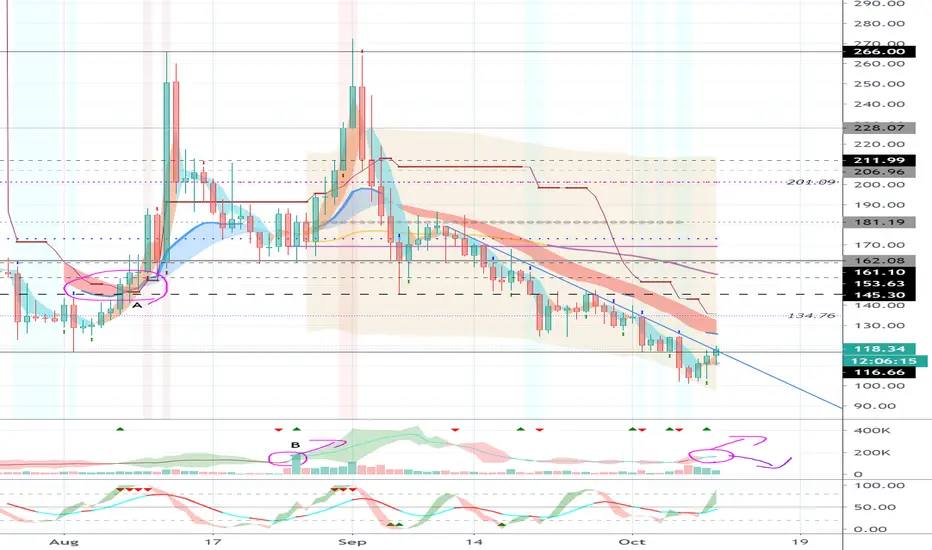
At this time, the downtrend cannot be seen as overflowing.
You have to wait until you get the same flow as A.
You need to make sure it can move like the B flow shown on the Volume indicator.
I think we can say that we are out of the downtrend by going sideways by rising above 162.08 points on the current chart.
-------------------------------------------------- -------------------------------------------
** Check support, resistance, and abbreviation points.
** Support or resistance is based on the closing price of the 1D chart.
** All explanations are for reference only and do not guarantee profit or loss on investment.
Explanation of abbreviations displayed on the chart
R: A point or section of resistance that requires a response to preserve profits
S-L: Stop-Loss point or section
S: A point or segment that can be bought for generating profit as a support point or segment
(Short-term Stop Loss can be said to be a point where profits and losses can be preserved or additionally entered through installment trading. You must trade from a short-term investment perspective.)
Hello, traders.
"Like" is a huge force for me.
By "following" you can always get new information quickly.
Thank you for always supporting me.
-------------------------------------------------- -----
At this time, the downtrend cannot be seen as overflowing.
You have to wait until you get the same flow as A.
You need to make sure it can move like the B flow shown on the Volume indicator.
I think we can say that we are out of the downtrend by going sideways by rising above 162.08 points on the current chart.
-------------------------------------------------- -------------------------------------------
** Check support, resistance, and abbreviation points.
** Support or resistance is based on the closing price of the 1D chart.
** All explanations are for reference only and do not guarantee profit or loss on investment.
Explanation of abbreviations displayed on the chart
R: A point or section of resistance that requires a response to preserve profits
S-L: Stop-Loss point or section
S: A point or segment that can be bought for generating profit as a support point or segment
(Short-term Stop Loss can be said to be a point where profits and losses can be preserved or additionally entered through installment trading. You must trade from a short-term investment perspective.)
Note
(1D chart)We must see if we can ascend above 116.66 points.
I think that a change in the flow can be expected only when a picture that breaks upwards above the MS-Signal index such as section A is drawn.
Therefore, you need to trade carefully until you get the same flow as section A.
Note
(1D chart)You need to make sure you can get support at point 116.66.
Sideways at 116.66 and see if you can amplify your expectations for the upside.
A sharp rise can lead to a sharp decline, so I think there must be a flow of stockpiling power before the rise.
We'll see if that section could be 116.66-124.51.
Note
(OKEX COMPUSDT 1D chart)We must see if we can ascend above 111.05.
The sell volume in the resistance section of 116.66-139.90 is expected to rise above the 145.30 point if it can be received at 111.05.
We'll see what's going on with the volatility around November 13th.
Other content (coins, stocks, etc.) is frequently posted on X.
X에 다른 내용(코인, 주식 등)이 자주 게시.
◆ t.me/readCryptoChannel
[HA-MS Indicator]
bit.ly/3YxHgvN
[OBV Indicator]
bit.ly/4dcyny3
X에 다른 내용(코인, 주식 등)이 자주 게시.
◆ t.me/readCryptoChannel
[HA-MS Indicator]
bit.ly/3YxHgvN
[OBV Indicator]
bit.ly/4dcyny3
Related publications
Disclaimer
The information and publications are not meant to be, and do not constitute, financial, investment, trading, or other types of advice or recommendations supplied or endorsed by TradingView. Read more in the Terms of Use.