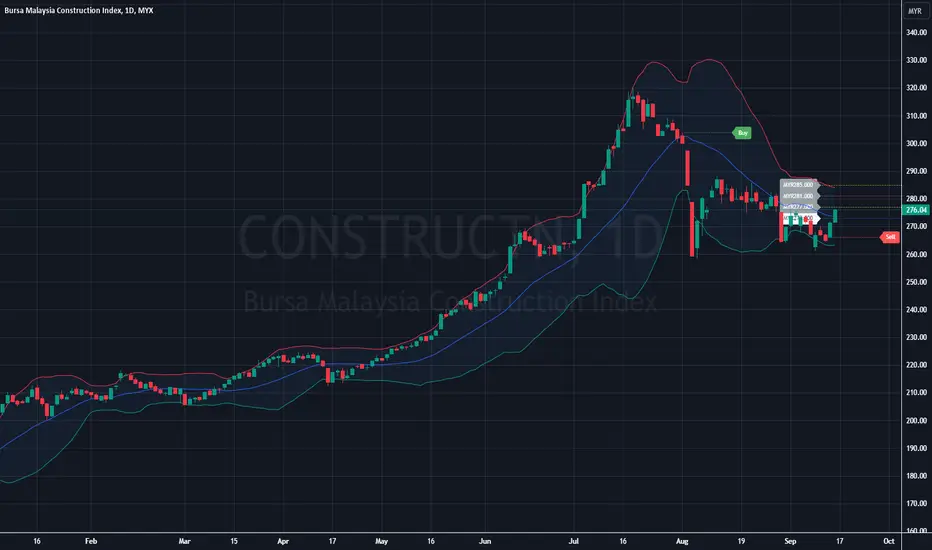
- The recent price action has seen the index bouncing near the middle band, suggesting a period of equilibrium after the correction.
- Resistance: The recent high around 320 can be considered a key resistance level. The price failed to sustain above this level in July, leading to the correction.
- Support: The recent low of approximately 260 in August seems to be providing support, as the price bounced back from there in September.
- The index is currently attempting a recovery, with today's candle showing a bullish move. However, it is still below the resistance level of 280-290.
- The market is in a consolidation phase after a strong correction. A breakout above 290 would indicate a continuation of the uptrend, while a drop below 260 could signal further downside.
Trade active
➀➁➂➃➄
Disclaimer
The information and publications are not meant to be, and do not constitute, financial, investment, trading, or other types of advice or recommendations supplied or endorsed by TradingView. Read more in the Terms of Use.
➀➁➂➃➄
Disclaimer
The information and publications are not meant to be, and do not constitute, financial, investment, trading, or other types of advice or recommendations supplied or endorsed by TradingView. Read more in the Terms of Use.