How low will she go?
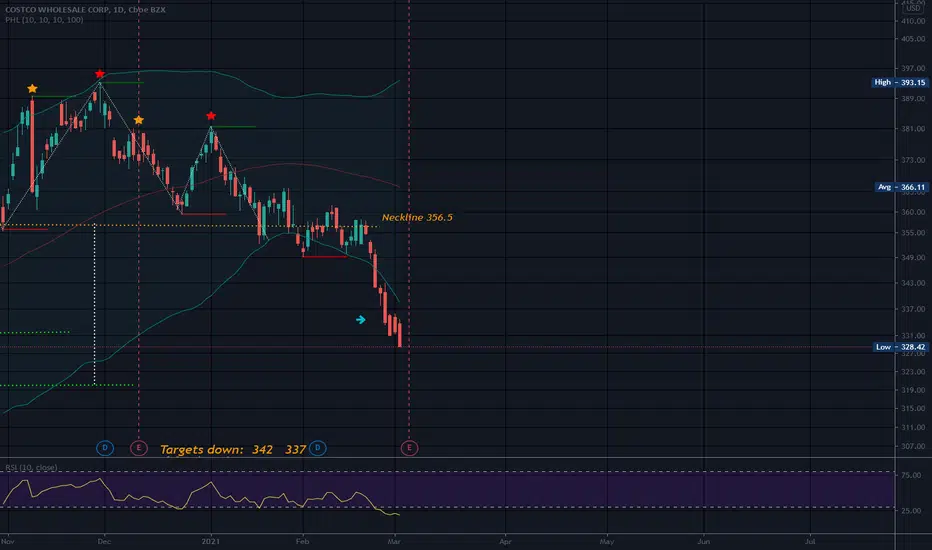
Looks to be extreme selling pressure and has broken bottom bollinger band with MA set at 80. Perhaps the sellers will become exhausted soon.
COST appears to have formed a head and shoulders several weeks ago and has suffered a large decline in the aftermath.
COST has met targets one on the short side which is unusual in a bull market. (see chart for targets 1 and 2). WMT is following the same pattern.
As a rule, head and shoulder patterns do not perform well in a bull market. Inverse head and shoulder perform well in a bull market. The opposite or vice versa, is true in a bear market.
Deeply oversold on RSI.
Watching only and not a recommendation
Note
just nowComment: This is an ugly top for sure, but the red can not go on forever..eventually the selling will end?
Note
COST has broken the neckline which should now become supportDisclaimer
The information and publications are not meant to be, and do not constitute, financial, investment, trading, or other types of advice or recommendations supplied or endorsed by TradingView. Read more in the Terms of Use.
Disclaimer
The information and publications are not meant to be, and do not constitute, financial, investment, trading, or other types of advice or recommendations supplied or endorsed by TradingView. Read more in the Terms of Use.