Costco's Clear Path: Targeting $1065!
https://tradingview.sweetlogin.com/news/zacks:bc29bb3c8094b:0-costco-s-july-sales-jump-signals-strong-finish-to-fiscal-2025/
https://tradingview.sweetlogin.com/news/DJN_SN20250806014261:0/
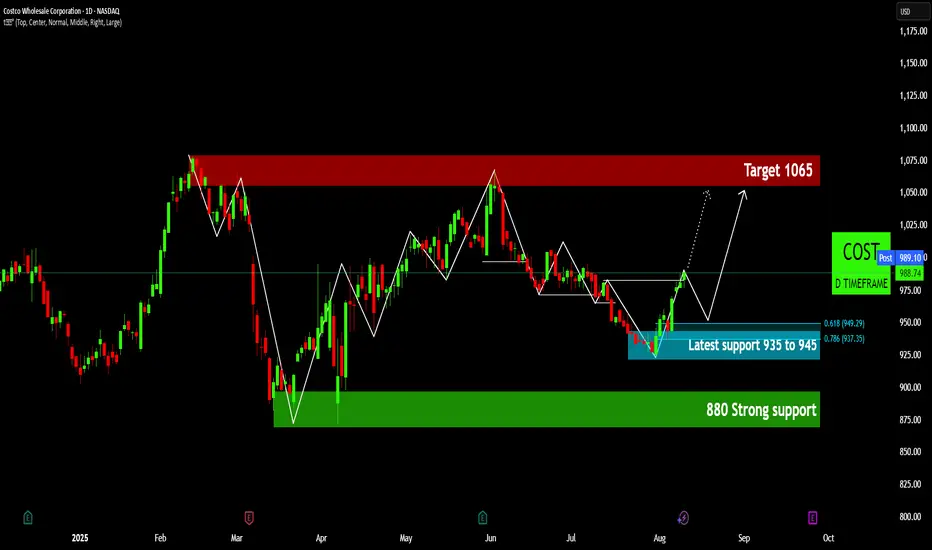
Costco Wholesale Corporation (COST) is exhibiting a compelling bullish setup on the daily timeframe, following a significant recovery from key support levels. The price action suggests a strengthening foundation and a clear trajectory towards previous highs.
•Robust Foundation: COST has demonstrated significant resilience, bouncing decisively from a pivotal $880 strong support zone. This level has proven to be a robust demand area, establishing a firm base for the stock's recent upward trajectory and highlighting strong institutional interest at lower valuations. 🏗️
•Constructive Reversal: More recently, a significant reversal commenced from the 'Latest support' zone, roughly between 920−940. This area, notably validated by key Fibonacci retracement levels, signals a powerful resurgence of buying interest, indicating a clear shift from bearish consolidation to bullish momentum. ✨
•Momentum & Consolidation: The stock is currently demonstrating strong upward momentum. While a minor consolidation or a healthy pullback to retest the newly established support within the 'Latest support' zone is a distinct possibility, such a move would be constructive. It would serve to solidify the recent gains and provide an even more stable launchpad for the next leg higher. 🚀
•Clear Upside Target: With robust support foundation and strong buying impetus, the primary upside objective for COST is the $1065 target zone. This region represents significant overhead resistance, aligning with previous highs, and offers a compelling near-term price target for this upward trajectory. 🎯
•Strategic Considerations: For traders and investors, maintaining focus on the integrity of the 'Latest support' (~920−940) is crucial. A sustained break below this area might challenge the immediate bullish outlook, though the deeper '880 Strong support' would serve as a formidable last line of defense, potentially offering long-term accumulation opportunities. ✅
Disclaimer:
The information provided in this chart is for educational and informational purposes only and should not be considered as investment advice. Trading and investing involve substantial risk and are not suitable for every investor. You should carefully consider your financial situation and consult with a financial advisor before making any investment decisions. The creator of this chart does not guarantee any specific outcome or profit and is not responsible for any losses incurred as a result of using this information. Past performance is not indicative of future results. Use this information at your own risk. This chart has been created for my own improvement in Trading and Investment Analysis. Please do your own analysis before any investments.
https://tradingview.sweetlogin.com/news/zacks:bc29bb3c8094b:0-costco-s-july-sales-jump-signals-strong-finish-to-fiscal-2025/
https://tradingview.sweetlogin.com/news/DJN_SN20250806014261:0/
Costco Wholesale Corporation (COST) is exhibiting a compelling bullish setup on the daily timeframe, following a significant recovery from key support levels. The price action suggests a strengthening foundation and a clear trajectory towards previous highs.
•Robust Foundation: COST has demonstrated significant resilience, bouncing decisively from a pivotal $880 strong support zone. This level has proven to be a robust demand area, establishing a firm base for the stock's recent upward trajectory and highlighting strong institutional interest at lower valuations. 🏗️
•Constructive Reversal: More recently, a significant reversal commenced from the 'Latest support' zone, roughly between 920−940. This area, notably validated by key Fibonacci retracement levels, signals a powerful resurgence of buying interest, indicating a clear shift from bearish consolidation to bullish momentum. ✨
•Momentum & Consolidation: The stock is currently demonstrating strong upward momentum. While a minor consolidation or a healthy pullback to retest the newly established support within the 'Latest support' zone is a distinct possibility, such a move would be constructive. It would serve to solidify the recent gains and provide an even more stable launchpad for the next leg higher. 🚀
•Clear Upside Target: With robust support foundation and strong buying impetus, the primary upside objective for COST is the $1065 target zone. This region represents significant overhead resistance, aligning with previous highs, and offers a compelling near-term price target for this upward trajectory. 🎯
•Strategic Considerations: For traders and investors, maintaining focus on the integrity of the 'Latest support' (~920−940) is crucial. A sustained break below this area might challenge the immediate bullish outlook, though the deeper '880 Strong support' would serve as a formidable last line of defense, potentially offering long-term accumulation opportunities. ✅
Disclaimer:
The information provided in this chart is for educational and informational purposes only and should not be considered as investment advice. Trading and investing involve substantial risk and are not suitable for every investor. You should carefully consider your financial situation and consult with a financial advisor before making any investment decisions. The creator of this chart does not guarantee any specific outcome or profit and is not responsible for any losses incurred as a result of using this information. Past performance is not indicative of future results. Use this information at your own risk. This chart has been created for my own improvement in Trading and Investment Analysis. Please do your own analysis before any investments.
Disclaimer
The information and publications are not meant to be, and do not constitute, financial, investment, trading, or other types of advice or recommendations supplied or endorsed by TradingView. Read more in the Terms of Use.
Disclaimer
The information and publications are not meant to be, and do not constitute, financial, investment, trading, or other types of advice or recommendations supplied or endorsed by TradingView. Read more in the Terms of Use.