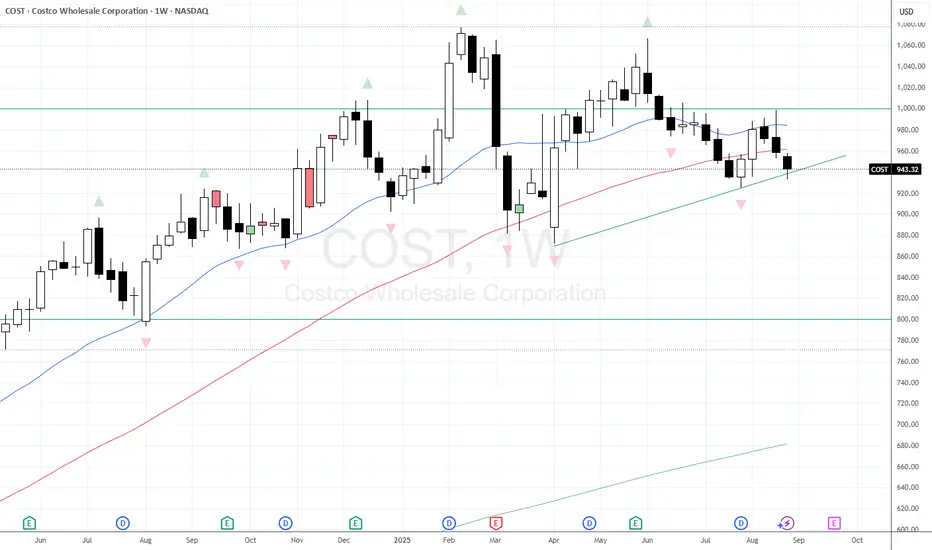
Like many people I've used Costco a fair bit over the summer. As a business I'm fascinated by it, and a supporter (mostly). As a trader I look at this chart and see us forming lower highs, bearish engulfing candles, bounces off $1000 levels, and now beneath the Weekly 50MA. Can this supporting trendline hold, and offer a bounce? Or will it break, and see COST move lower? Presently I'm more bearish.
Disclaimer
The information and publications are not meant to be, and do not constitute, financial, investment, trading, or other types of advice or recommendations supplied or endorsed by TradingView. Read more in the Terms of Use.
Disclaimer
The information and publications are not meant to be, and do not constitute, financial, investment, trading, or other types of advice or recommendations supplied or endorsed by TradingView. Read more in the Terms of Use.