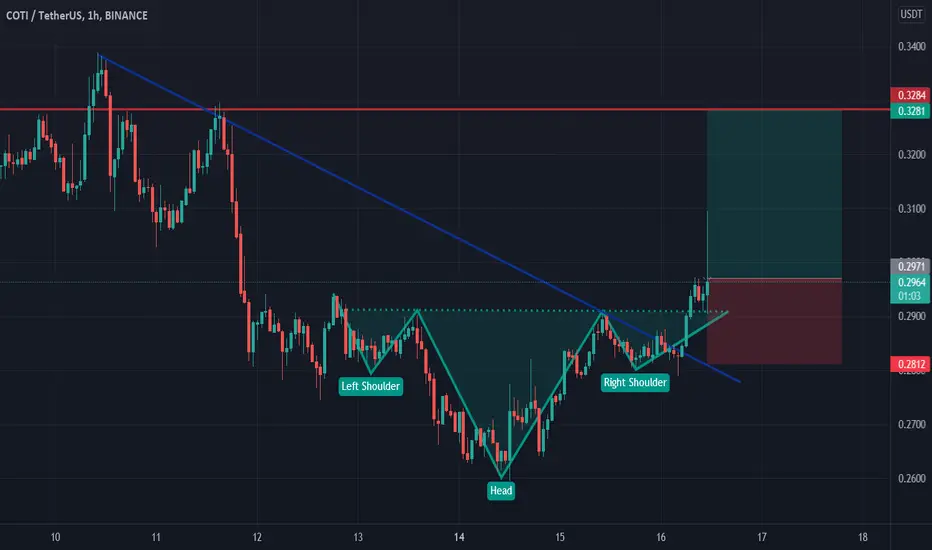
Inverse Head and Shoulders pattern has formed on the COTI/USDT chart. COTI is now broke through the Neck-line and descending trendline. Bullish movement to resistance level at 0.328 is expected to happen.
Disclaimer
The information and publications are not meant to be, and do not constitute, financial, investment, trading, or other types of advice or recommendations supplied or endorsed by TradingView. Read more in the Terms of Use.
Disclaimer
The information and publications are not meant to be, and do not constitute, financial, investment, trading, or other types of advice or recommendations supplied or endorsed by TradingView. Read more in the Terms of Use.