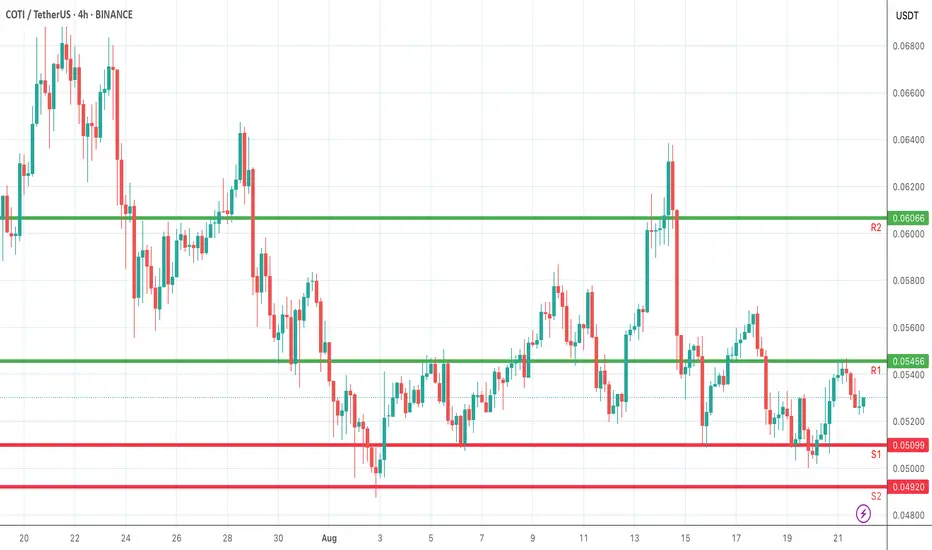
On the 4-hour chart, key support and resistance levels have been identified. S1 and S2 mark the downside areas where buyers may step in, providing potential rebound zones. R1 and R2 highlight the upside resistance barriers, where sellers could apply pressure or profit-taking may occur. These zones will guide short-term trading decisions: a break above resistance could indicate bullish momentum, while a drop below support may signal extended weakness. Traders can use these levels for setting entries, stop-losses, and profit targets, while also confirming signals with volume and trend indicators.
Disclaimer
The information and publications are not meant to be, and do not constitute, financial, investment, trading, or other types of advice or recommendations supplied or endorsed by TradingView. Read more in the Terms of Use.
Disclaimer
The information and publications are not meant to be, and do not constitute, financial, investment, trading, or other types of advice or recommendations supplied or endorsed by TradingView. Read more in the Terms of Use.