COTIUSDT Technical analysis update
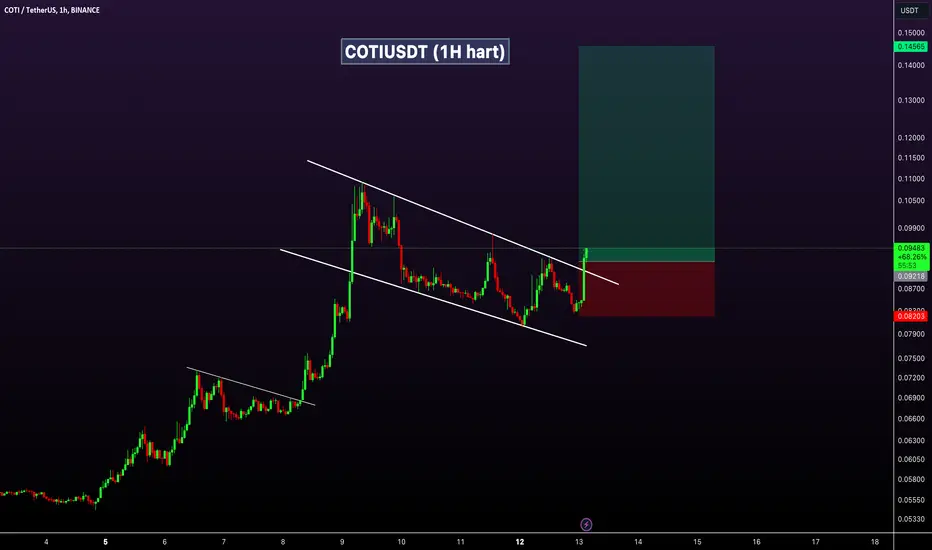
COTI broke the resistance line of an flag pattern on the 1-hour chart. This could indicate potential upward movement for COTI
Buy zone : Below $0.093
Stop loss : $0.082
Reagrds
Hexa
COTI broke the resistance line of an flag pattern on the 1-hour chart. This could indicate potential upward movement for COTI
Buy zone : Below $0.093
Stop loss : $0.082
Reagrds
Hexa
Note
COTIUSDT 58%+ profit🚀Telegram : t.me/hexatrades
🌐Website: hexatrades.io/
🗣️Twitter(X): twitter.com/HexaTrades
🌐Website: hexatrades.io/
🗣️Twitter(X): twitter.com/HexaTrades
Related publications
Disclaimer
The information and publications are not meant to be, and do not constitute, financial, investment, trading, or other types of advice or recommendations supplied or endorsed by TradingView. Read more in the Terms of Use.
🚀Telegram : t.me/hexatrades
🌐Website: hexatrades.io/
🗣️Twitter(X): twitter.com/HexaTrades
🌐Website: hexatrades.io/
🗣️Twitter(X): twitter.com/HexaTrades
Related publications
Disclaimer
The information and publications are not meant to be, and do not constitute, financial, investment, trading, or other types of advice or recommendations supplied or endorsed by TradingView. Read more in the Terms of Use.