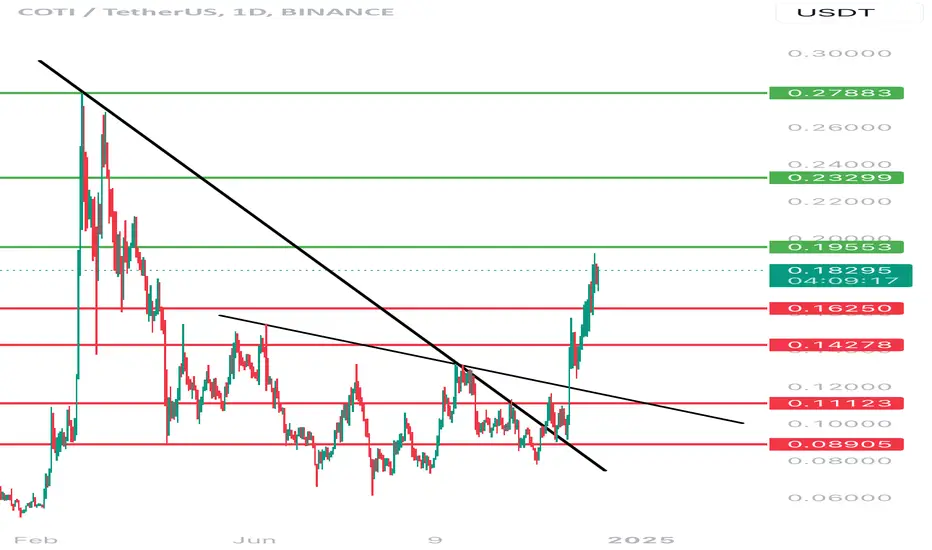
Hello everyone, let's look at the 1D COTI to USDT chart, in this situation we can see how the price broke out of the first and then the second downtrend line, which gave dynamic upward movements.
Let's start by setting goals for the near future, which include:
T1 = $0.196
T2 = $0.233
T3 = $0.279
Now let's move on to the stop-loss in case the market continues to decline:
SL1 = $0.163
SL2 = $0.143
SL3 = $0.111 AND
SL4 = $0.089
Let's start by setting goals for the near future, which include:
T1 = $0.196
T2 = $0.233
T3 = $0.279
Now let's move on to the stop-loss in case the market continues to decline:
SL1 = $0.163
SL2 = $0.143
SL3 = $0.111 AND
SL4 = $0.089
Disclaimer
The information and publications are not meant to be, and do not constitute, financial, investment, trading, or other types of advice or recommendations supplied or endorsed by TradingView. Read more in the Terms of Use.
Disclaimer
The information and publications are not meant to be, and do not constitute, financial, investment, trading, or other types of advice or recommendations supplied or endorsed by TradingView. Read more in the Terms of Use.